 en
enDaily Analysis 30/08/2024
Latest Economic and Fundamental Insights
The dollar index held steady around 101.4 on Friday after rising for two straight sessions, as investors prepared for the July personal consumption expenditures price index report, the Federal Reserve’s preferred inflation gauge.
Gold heads for monthly rise; eyes on US inflation data
“The overall trend for gold remains bullish due to lower interest rates and geopolitical tensions,” said Peter Fung, head of trading at Wing Fung Precious Metals.
“By the end of the year, prices are expected to break the $2,650 barrier, and in the medium to long term, we expect it to exceed $2,800 and possibly even $3,000.”
-Traders are currently pricing in the full potential for a U.S. rate cut next month, with a 66% chance of a 25 basis point cut and a 34% chance of a 50 basis point cut, according to the CME FedWatch tool.
These possibilities may be affected by the US Personal Consumption Expenditures data, scheduled to be released at 15:30 Mecca time.
“The size of the Fed’s potential rate cut in September could be influenced by how weak or weak the core PCE is,” said Tim Waterer, chief market analyst at KCM Trade.
Weekly applications for unemployment benefits in the United States fell slightly last week but opportunities for laid-off workers to find work again became scarcer, data released Thursday showed.
-On the geopolitical front, the Israeli military and the Palestinian Hamas movement agreed to three separate three-day pauses in fighting in the Gaza Strip to allow children to be vaccinated against polio, a senior World Health Organization official said. Tensions were otherwise high amid fears of a wider conflict.
Gold prices fell at the beginning of the Asian session.
A combination of cyclical factors points to weak demand for the precious metal in China in the near term.
-Rising gold prices are weighing on demand for jewelry, fiscal stimulus would provide a much-needed boost to the Chinese economy, and stock market performance would improve as domestic stocks decline.
Asian stocks rose on Friday, set for a strong end to August, while the dollar was facing its worst monthly performance in nine months amid expectations the U.S. Federal Reserve is certain to cut interest rates next month.
Oil rises on Middle East supply concerns, with Brent trading at $79.00 and WTI at $7,500
Both benchmarks rose more than a dollar on Thursday on concerns about oil supplies, and are up 1.5% and 1.7% respectively for the week so far.
“Ongoing concerns about disruption to Libyan supplies have been compounded by Iraq’s plans to tame production, which together could hurt global oil supplies,” said Priyanka Sachdeva, senior market analyst at Philip Nova.
“However, the bleak economic outlook for China, the world’s largest importer of crude oil, remains a persistent drag on oil demand.”
More than half of Libya’s oil production, or about 700,000 barrels per day, was shut down on Thursday and exports halted at several ports after a standoff between rival political factions.
-Libyan production losses may reach between 900,000 and 1 million barrels per day, and continue for several weeks.
-Bitcoin price remained stable above the support area at $58,500. Bitcoin is facing difficulties and may start a steady rise only if it breaks the $61,500 level.
Smart technical reports
How they work
A likely scenario is proposed for today, and the probability of this scenario being achieved, according to technical analysis, may be between 60% and 75%.
If the first scenario fails, the probability of the second scenario being achieved will be between 60% and 75% certain.
The first scenario fails when the price reaches the level of the alternative scenario condition, and the alternative scenario is immediately activated and the prediction from the first scenario is cancelled.
These reports are not considered a substitute for the trader’s decision, but rather they are a tool to assist the follower in making his own decisions, as a reference based on the origins of classical technical analysis.
GOLD
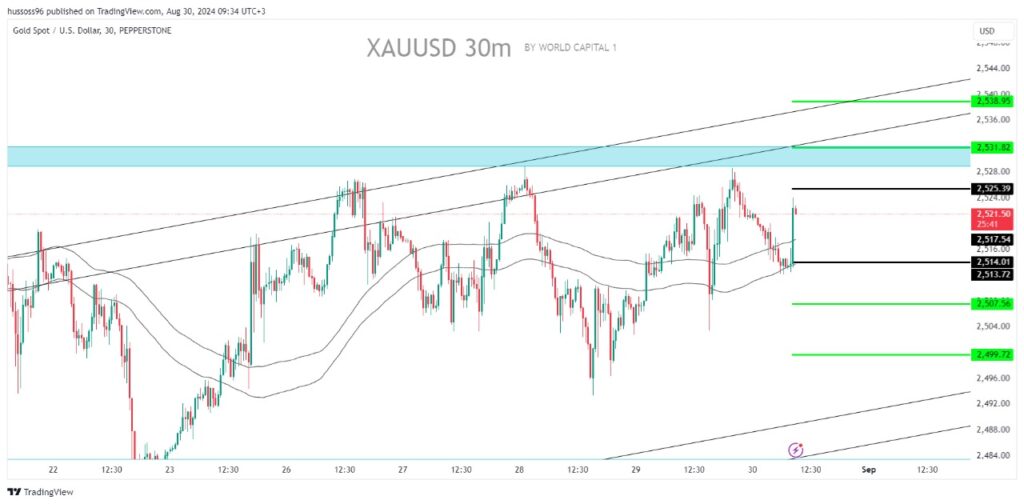
General trend: Upward
Interval: Half an hour (30 minutes)
Current price: 2521.50
Scenario 1: Buy gold with a break and stability above 2525.39, targeting 2531.82 and 2538.95
Alternative scenario: Sell gold with a break and stability below 2514.01 with a target price of 2507.56 and then 2499.72
Comment: Trading above the supports and averages suggests an upward trend.
CRUDE OIL
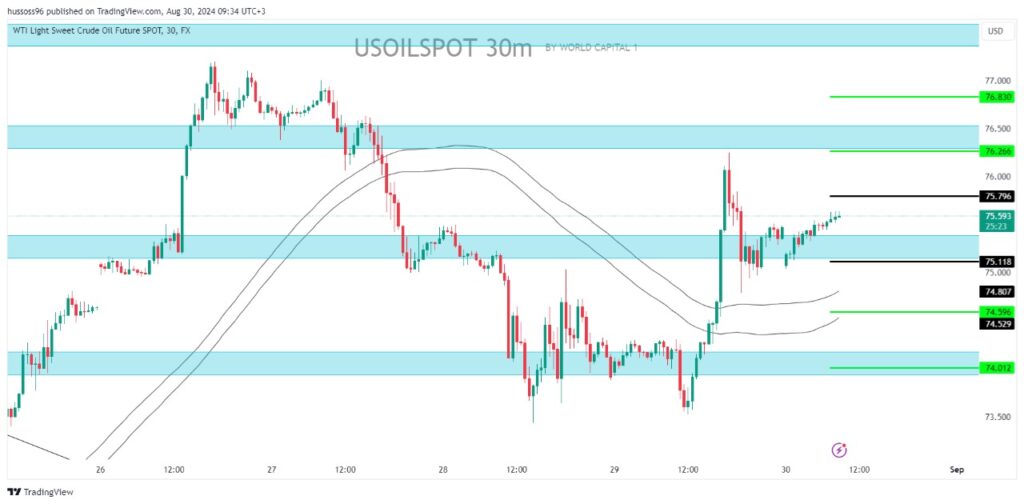
Trend: Upward
Interval: Half an hour (30 minutes)
Current price: $75.59 per barrel
Scenario 1: Buy oil by breaking the $75.79 level, targeting $76.26 and then $7683.
Alternative scenario: Sell oil with a break and stability by closing a candle below the $75.11 levels, targeting $74.59 and then $74.01.
Comment: Trading above the supports and averages suggests an upward trend.
EURUSD
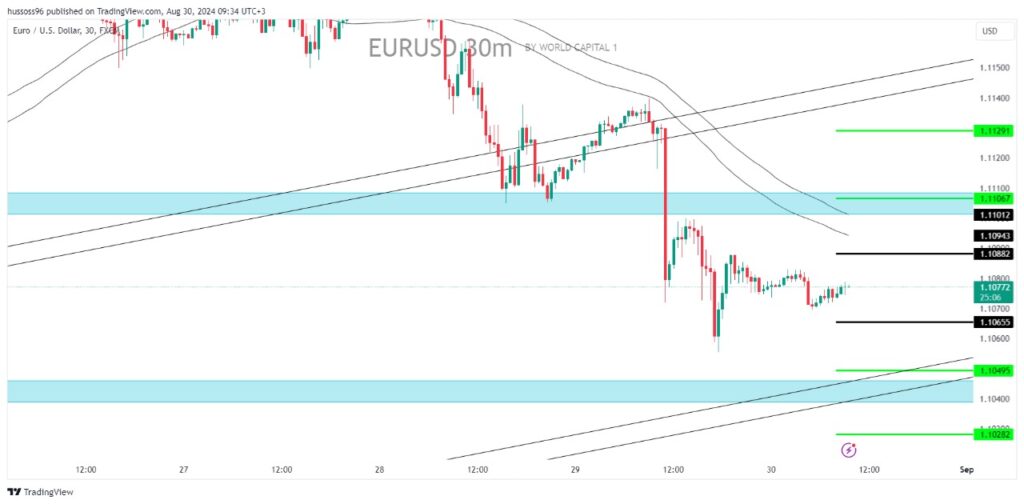
General trend: Upward
Interval: Half an hour (30 minutes)
Current price: 1.10772
Scenario 1: Buy EUR/USD by breaking 1.10882, targeting 1.11067 and then 1.11291
Alternative scenario: Sell the EUR/USD with a break and stability with a candle closing below 1.10655, targeting 1.10495 and then 1.10282
Comment: Trading above the supports and averages suggests an upward trend.
GBPUSD
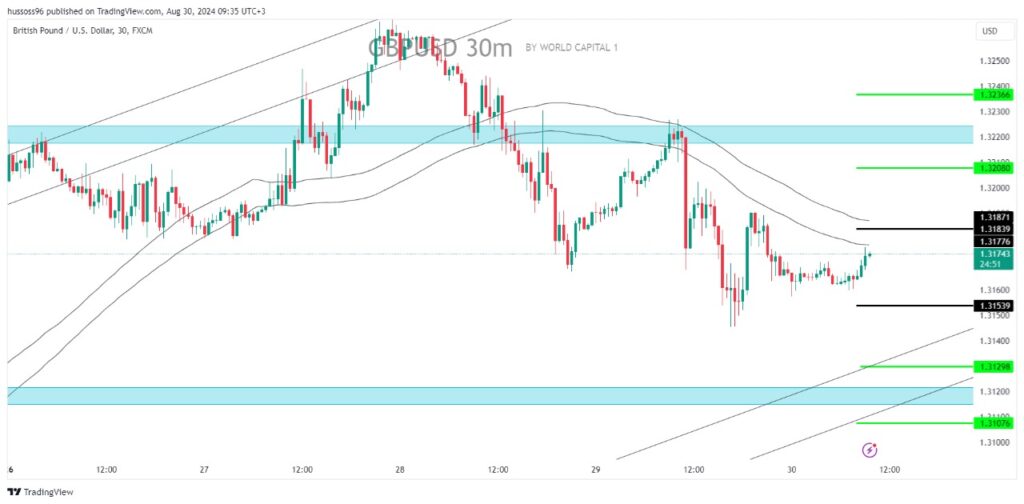
Trend: Upward
Interval: Half an hour (30 minutes)
Current price: 1.31743
Scenario 1: Buy the pound dollar with a break and stability above the level of 1.31871, targeting the price of 1.32080 and then 1.32366
Alternative scenario: Selling the pound dollar with a break and stability with a close below 1.31539, targeting 1.31298 and then 1.31076
Comment: Trading above the supports and averages suggests an upward trend.
NAS100
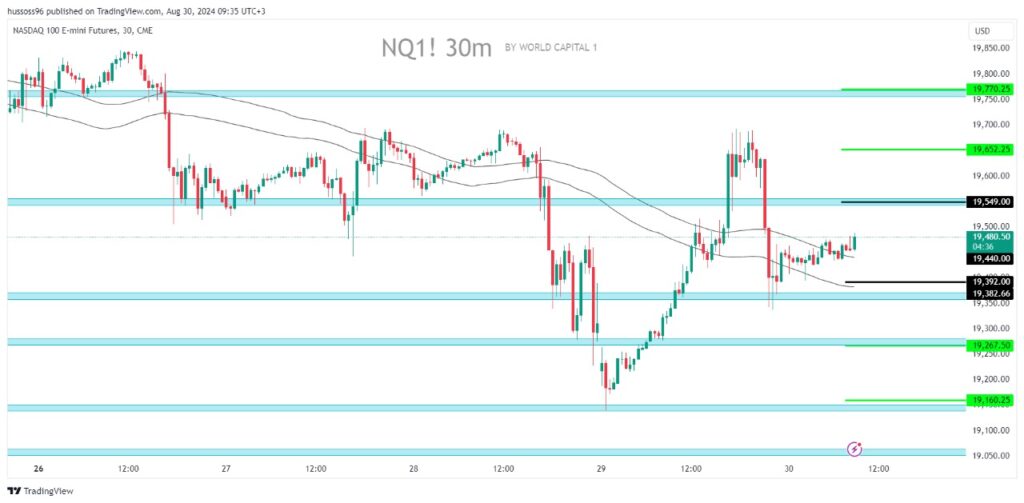
Trend: Upward
Interval: Half an hour (30 minutes)
Current price: 19480
Scenario 1: Buy Nasdaq with a break and hold with a close above 19549, targeting 19652 then 19770
Alternative scenario: Sell Nasdaq with break and hold with close below 19392 with target price 19267 then 19160
Comment: Trading above the supports and averages suggests an upward trend.
Economic Calendar
(Times are in GMT+3)
-From Europe Consumer Price Index (YoY) (Aug) 12:00
-From USA Core Personal Consumption Expenditure Price Index (MoM) (July) 15:30
-From USA Core Personal Consumption Expenditure Price Index (YoY) (July) 15:30
-From Canada Government Budget (YoY) (June) 18:00
Fundamental Analysis
The dollar index held steady around 101.4 on Friday after rising for two straight sessions, as investors prepared for the July personal consumption expenditures price index report, the Federal Reserve’s preferred inflation gauge.
The market is looking for confirmation that prices are on a downward trend, giving the Fed more room to cut interest rates.
The central bank is widely expected to start easing monetary policy in September, with total cuts of around 100 basis points this year.
The dollar index rose 0.3% on Thursday as the latest U.S. GDP figures and initial jobless claims data helped ease recession fears.
However, the US dollar is expected to record its worst monthly decline since November last year, amid dovish Fed bets.
Among major currencies, the US dollar recorded the largest decline against the New Zealand dollar in August, losing more than 5%, followed by the Australian dollar (-4%), the yen (-3.4%) and the British pound (-2.5%).
Gold prices fell on Friday, but were set for a second straight monthly gain as bets grew that the Federal Reserve will cut interest rates next month, while traders awaited key U.S. inflation data for additional guidance.
Oil prices rose slightly on Friday as investors assessed supply concerns in the Middle East, although signs of weak demand capped gains.
Risk Disclaimer
Any information/articles/materials/content provided by WRC1 or displayed on its website is intended to be used solely for educational purposes only and does not constitute investment advice or a consultation on how the client should trade.
Although WRC1 has taken care to ensure that the content of such information is accurate, - it cannot be held responsible for any omission/error/miscalculation and cannot guarantee the accuracy of any material or any information contained herein.
Therefore, any reliance you place on such material is strictly at your own risk. Please note that the responsibility for using or relying on such material rests with the client and WRC1 accepts no liability for any loss or damage, including without limitation, any loss of profit which may arise directly or indirectly from the use of or reliance on such information.
Risk Warning: FX/CFDs are complex instruments and carry a high risk of losing money quickly due to leverage. You should consider whether you understand how FX/CFDs work and whether you can afford to take the high risk of losing your money.
You should make sure that, depending on your country of residence, you are allowed to trade with WRC1 products. Please ensure that you are familiar with the company’s risk disclosure.
