 en
enDaily Analysis 23/07/2024
Latest Economic and Fundamental Insights
The dollar index held steady around 104.2 on Tuesday as investors continued to assess the U.S. political landscape following President Joe Biden’s decision to end his re-election bid and endorse Vice President Kamala Harris as the Democratic nominee.
Gold prices steady with focus on US economic data
Markets await US CPI data on Friday, gold looks steady at $2,400
Markets will focus on Friday’s U.S. PCE data. Other releases include existing home sales, S&P Global’s preliminary July purchasing managers’ indexes, second-quarter gross domestic product and weekly jobless claims.
Asian demand for physical gold was sluggish last week, reflecting a reluctance by customers to make new purchases despite deep discounts, and instead taking advantage of record high bullion prices.
Traders are awaiting the second-quarter GDP report on Thursday and June personal consumption expenditures data on Friday.
“Gold looks very comfortable around $2,400 at the moment, so there is room for a slight rebound before GDP releases,” said Matt Simpson, senior analyst at City Index.
“But if growth surprises us to the upside, I still think gold can hold above $2,360 in the current environment.”
Gold prices hit an all-time high of $2,483.60 an ounce last week as markets widely expect a 25 basis point U.S. interest rate cut by September. Lower interest rates reduce the opportunity cost of holding bullion. (FEDWATCH)
-On the political front, US Vice President Kamala Harris will campaign in Wisconsin for the first time as a presidential candidate after a sufficient number of Democratic delegates pledged their support for her, paving the way for her to obtain the nomination.
-When he accepted the Republican nomination, Donald Trump pledged to cut corporate taxes and interest rates. Lower tax revenues could widen the U.S. federal budget deficit. Many investors believe the deficit will continue to worsen under a second Democratic administration as well.
“While there is a lack of commodity trading ahead of the election given the range of scenarios that could play out, gold emerges as the winner,” JPMorgan said in a note.
“Gold’s structural bullish factors, such as growing concerns about complacency over rising financial debt, tariffs and trade retaliation, as well as the widespread “America First” rhetoric, are likely to remain intact.”
Asian stock markets steadied on Tuesday as semiconductor stocks rebounded to break a costly losing streak, while a bleak demand outlook from China dragged down commodity prices and investors turned their attention to U.S. earnings and data.
Oil stabilizes amid expected surplus amid weak demand, with Brent crude trading at $82.00 and WTI at $78.00
Traders mostly shrugged off U.S. President Joe Biden’s decision to scrap his re-election bid and endorse Vice President Kamala Harris on Sunday. Citi analysts said they believed neither Harris nor Republican nominee Donald Trump would push policies that would significantly impact oil and gas operations.
Instead, the market focused on fundamentals, which Morgan Stanley analysts said were likely to balance out by the fourth quarter and rise to a supply surplus by next year, which would push Brent prices down to the mid-to-high $70s a barrel.
Any rise in oil prices is more due to market consolidation and dip buying activity, said Priyanka Sachdeva, senior market analyst at Philip Nova.
-Bitcoin price remained below the $68,500 resistance area. Bitcoin is consolidating its gains and may target a fresh upside move in the near term.
Smart technical reports
How they work
A likely scenario is proposed for today, and the probability of this scenario being achieved, according to technical analysis, may be between 60% and 75%.
If the first scenario fails, the probability of the second scenario being achieved will be between 60% and 75% certain.
The first scenario fails when the price reaches the level of the alternative scenario condition, and the alternative scenario is immediately activated and the prediction from the first scenario is cancelled.
These reports are not considered a substitute for the trader’s decision, but rather they are a tool to assist the follower in making his own decisions, as a reference based on the origins of classical technical analysis.
GOLD
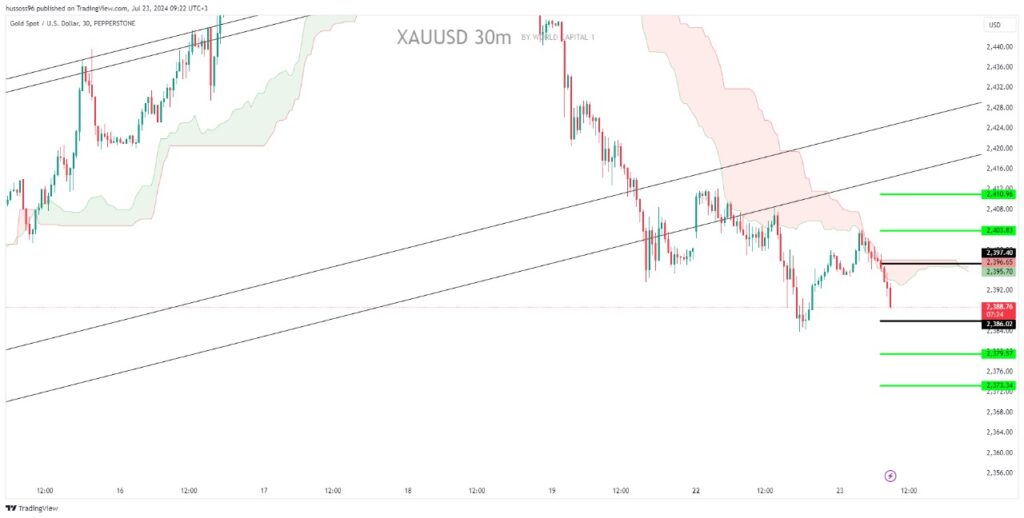
General trend: Down
Interval: Half an hour (30 minutes)
Current price: 2388.76
Scenario 1: Sell gold with a break and stability below 2386.02, targeting 2379.57 and 2373.34
Alternative scenario: Buy gold with a break and stability above 2397.40, targeting 2403.83 and then 2410.96
Comment: Trading below the resistances and averages suggests a decline.
CRUDE OIL
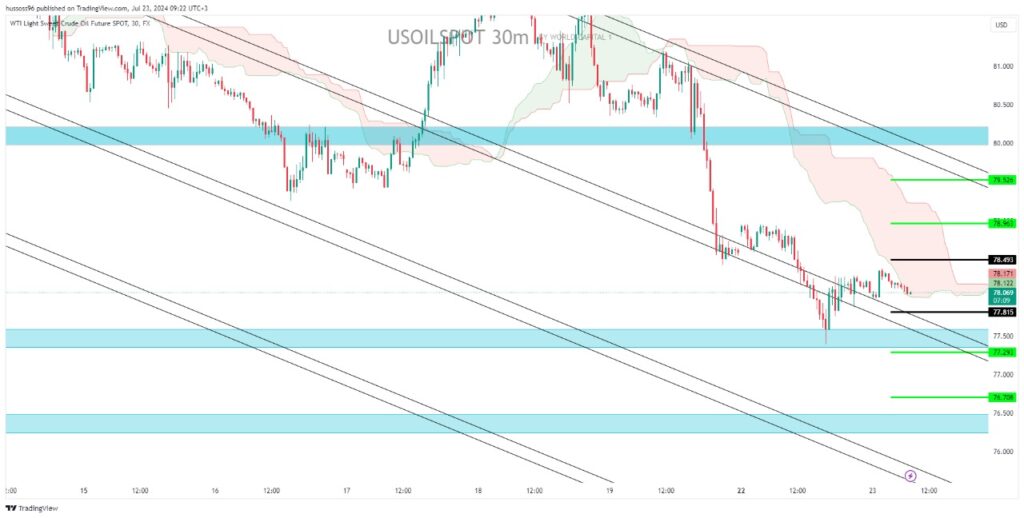
Trend: Down
Interval: Half an hour (30 minutes)
Current price: $78.06 per barrel
Scenario 1: Sell oil with a break and stability by closing a candle below the $77.81 levels, targeting $77.29 and then $76.70.
Alternative scenario: Buy oil by breaking the $78.49 level, targeting $78.96 and then $79.52
Comment: Trading below the resistances and averages suggests a decline.
EURUSD
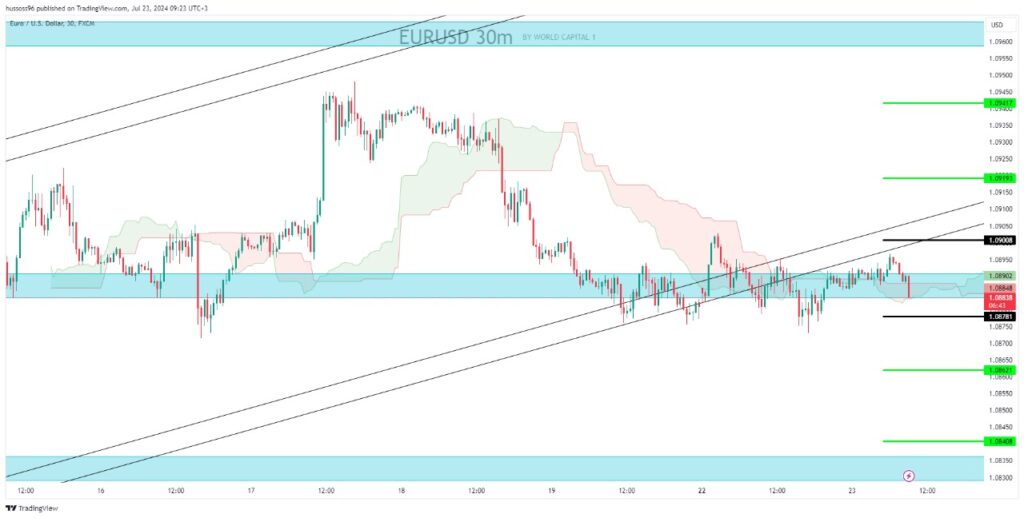
General trend: Upward
Interval: Half an hour (30 minutes)
Current price: 1.08838 Scenario 1: Buy EUR/USD by breaking 1.09008, targeting 1.091193 and then 1.09417
Alternative scenario: Sell the EUR/USD with a break and stability with a candle closing below 1.08781, targeting 1.08621 and then 1.08408.
Comment: Trading above the supports and averages suggests an upward trend.
GBPUSD
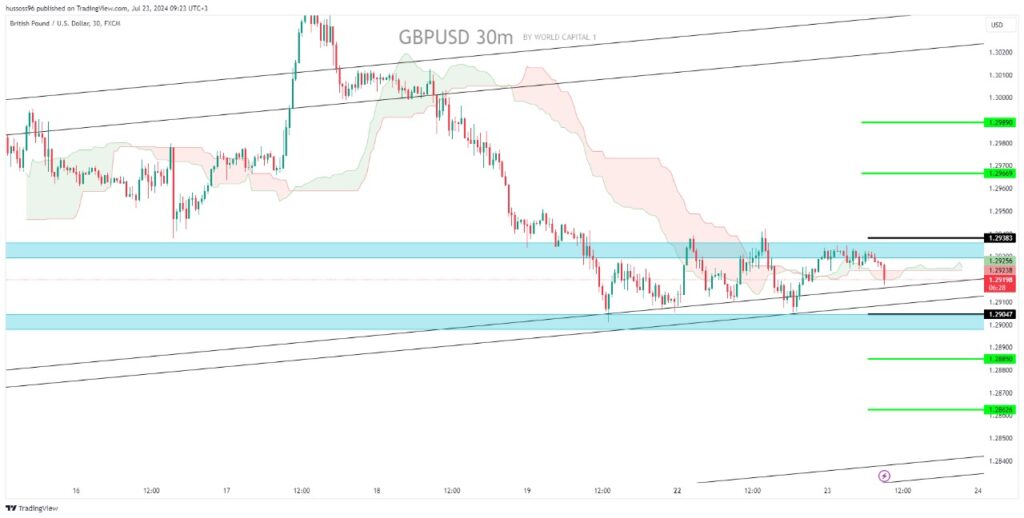
Trend: Upward
Time interval: half an hour (30 minutes)
Current price: 1.29198
Scenario 1: Buy the pound dollar with a break and stability above the 1.29383 level, targeting the price of 1.29669 and then 1.29890.
Alternative scenario: Selling the pound dollar with a break and stability with a close below 1.29047, targeting 1.28850 and then 1.28626
Comment: Trading above the supports and averages suggests an upward trend.
NAS100
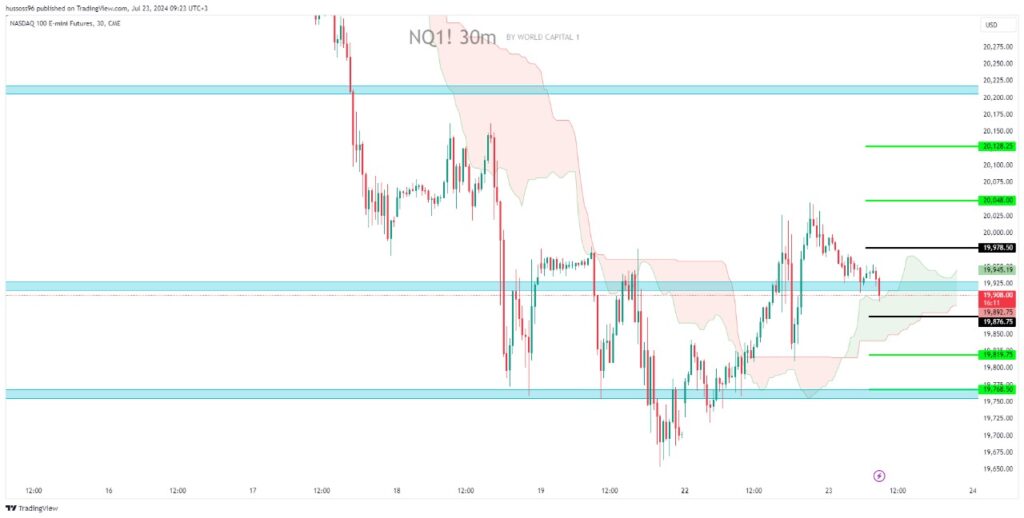
Trend: Down
Interval: Half an hour (30 minutes)
Current price: 19908
Scenario 1: Selling the Nasdaq with a break and stability with a close below 19876, targeting a price of 19819 and then 19768.
Alternative scenario: Buy Nasdaq with break and hold with close above 19978 price 20048 then 20128
Comment: Trading below the resistances and averages suggests a decline.
Economic Calendar
(Times are in GMT+3)
From USA Existing Home Sales (June) 17:00
Fundamental Analysis
The dollar index held steady around 104.2 on Tuesday as investors continued to assess the U.S. political landscape following President Joe Biden’s decision to end his re-election bid and endorse Vice President Kamala Harris as the Democratic nominee.
However, former President Donald Trump still leads the race, although market participants have begun to pare back the so-called Trump trade that had been supporting the dollar and Treasury yields.
On the monetary policy front, the US Federal Reserve is widely expected to begin cutting interest rates in September amid slowing inflation, with two more cuts expected before the end of the year.
Investors are now looking ahead to key US economic data this week including preliminary PMIs, GDP and the PCE price index report.
The dollar traded in a narrow range against most major currencies, but strengthened against the yuan, Australian and New Zealand dollars following a surprise interest rate cut by China’s central bank earlier this week.
Gold prices steadied on Tuesday as investors awaited U.S. economic data this week for more clarity on the Federal Reserve’s timetable for interest rate cuts.
Oil prices steadied on Tuesday after falling in the past two sessions, as investors remained cautious amid expectations of ample supplies and weak demand, while shrugging off turmoil in the U.S. presidential election campaign.
Risk Disclaimer
Any information/articles/materials/content provided by WRC1 or displayed on its website is intended to be used solely for educational purposes only and does not constitute investment advice or a consultation on how the client should trade.
Although WRC1 has taken care to ensure that the content of such information is accurate, - it cannot be held responsible for any omission/error/miscalculation and cannot guarantee the accuracy of any material or any information contained herein.
Therefore, any reliance you place on such material is strictly at your own risk. Please note that the responsibility for using or relying on such material rests with the client and WRC1 accepts no liability for any loss or damage, including without limitation, any loss of profit which may arise directly or indirectly from the use of or reliance on such information.
Risk Warning: FX/CFDs are complex instruments and carry a high risk of losing money quickly due to leverage. You should consider whether you understand how FX/CFDs work and whether you can afford to take the high risk of losing your money.
You should make sure that, depending on your country of residence, you are allowed to trade with WRC1 products. Please ensure that you are familiar with the company’s risk disclosure.
