 en
enDaily Analysis 23/01/2024
Latest Economic and Fundamental Insights
- The dollar index fell around 103.2 on Tuesday, and has remained steady so far this week as investors cautiously await key US economic data this week including private sector activity, gross domestic product and personal consumption expenditures inflation numbers.
- Gold drifts higher as dollar declines ahead of central bank rulings.
- The Bank of Japan keeps interest rates steady.
- The Fed’s first cut is now expected to take place in May with a probability of 88%.
- ADNOC’s fuel oil sales from Ruwais refinery increased in January.
- The US PMI is due tomorrow, Wednesday, the GDP advance estimate is due on Thursday, and personal consumption expenditures are due on Friday.
- Super Micro Computer stock rose 36% to record optimistic earnings expectations.
- NVIDIA stock rose 10% after breaking 550 levels to record its highest levels ever.
- Oil rises 2 percent due to supply disruptions in Russia and America, with Brent crude trading at $80.00 and West Texas Intermediate crude at $74.00.
- Bitcoin ETFs recorded net outflows of $76 million on the seventh bad day of trading, reaching levels of $39,500, the lowest level in a month and a half.
Smart technical reports
How they work
A likely scenario is proposed for today, and the probability of this scenario being achieved, according to technical analysis, may be between 60% and 75%.
If the first scenario fails, the probability of the second scenario being achieved becomes between 60% and 75% certain.
The first scenario fails when the price reaches the level of the alternative scenario condition, and the alternative scenario is immediately activated and the prediction from the first scenario is cancelled.
These reports are not considered a substitute for the trader’s decision, but rather they are a tool to assist the follower in making his own decisions, as a reference based on the origins of classical technical analysis.
GOLD
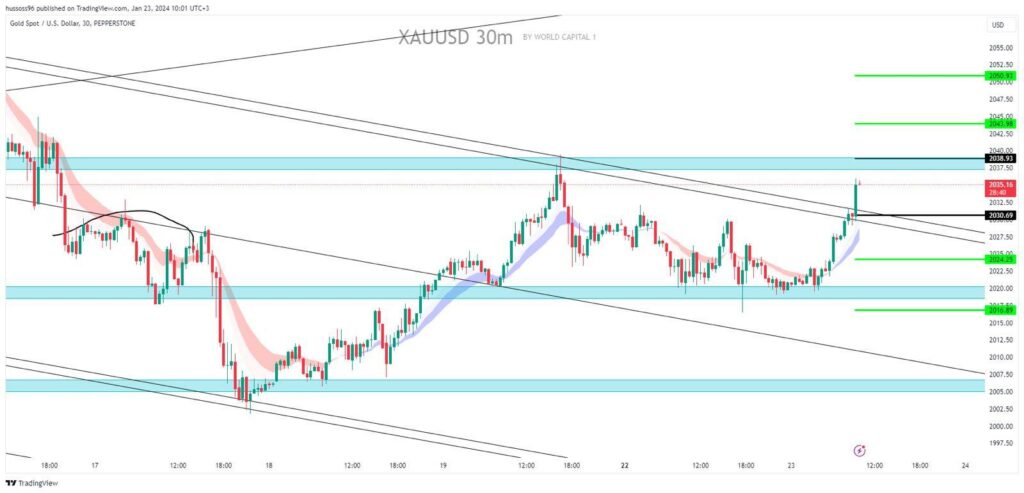
General trend: bullish
Time interval: half an hour (30 minutes)
Current price: 2035.16
The first scenario: Buy gold at a fraction and hold below 2038.93, with a target price of 2043.98 and 2050.93. Alternative scenario: Sell gold at a break and hold below 2030.25, with a target price of 2024.25 and then 2016.89.
Comment: Trading above the supports and averages is likely to rise
CRUDE OIL
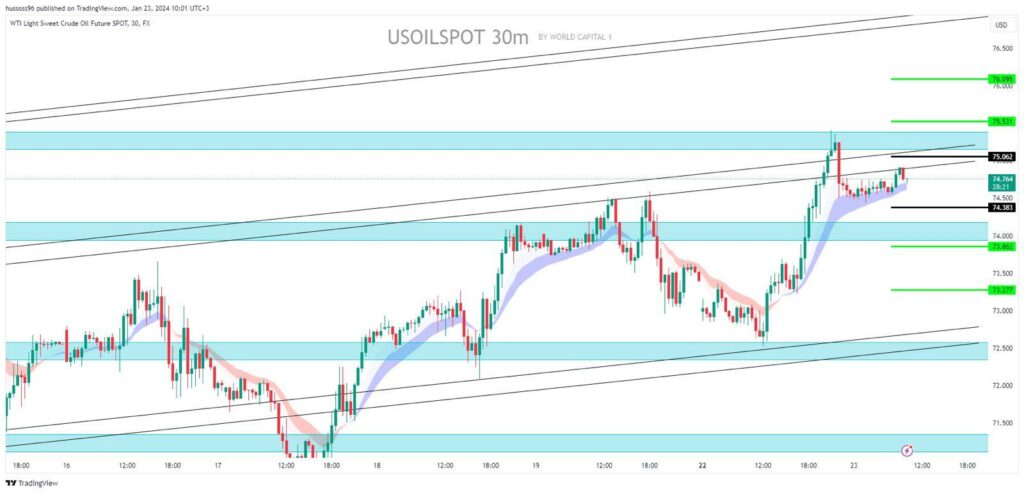
Trend: bullish
Time interval: half an hour (30 minutes)
Current price: $74.76 per barrel
The first scenario: Buy oil at a break and hold steady by closing the candle at the highest levels of $75.06, targeting a price of $75.53, then 76.09.
Alternative scenario: Sell oil by breaking the $74.38 level, targeting $73.86, then 73.27.
Comment: Trading above the supports and averages is likely to rise
EURUSD
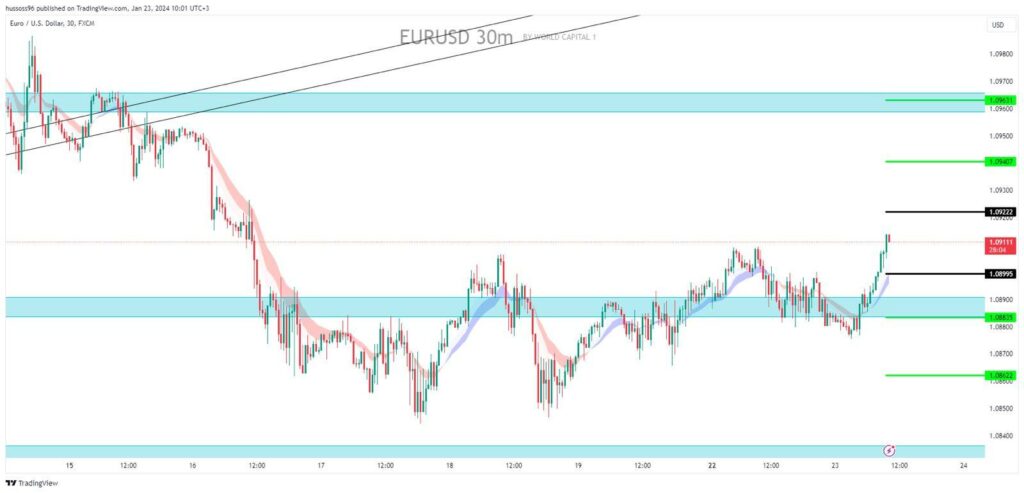
General trend: bearish
Time interval: half an hour (30 minutes)
Current price: 1.09111
The first scenario: selling the euro/dollar at a break of 1.08995, targeting a price of 1.08835, then 1.08622.
Alternative scenario: Buy the Euro/Dollar at a break and hold by closing the candle above 1.09222, targeting the price of 1.09407 then 1.09631.
Comment: Trading below the resistances and averages is likely to fall
GBPUSD
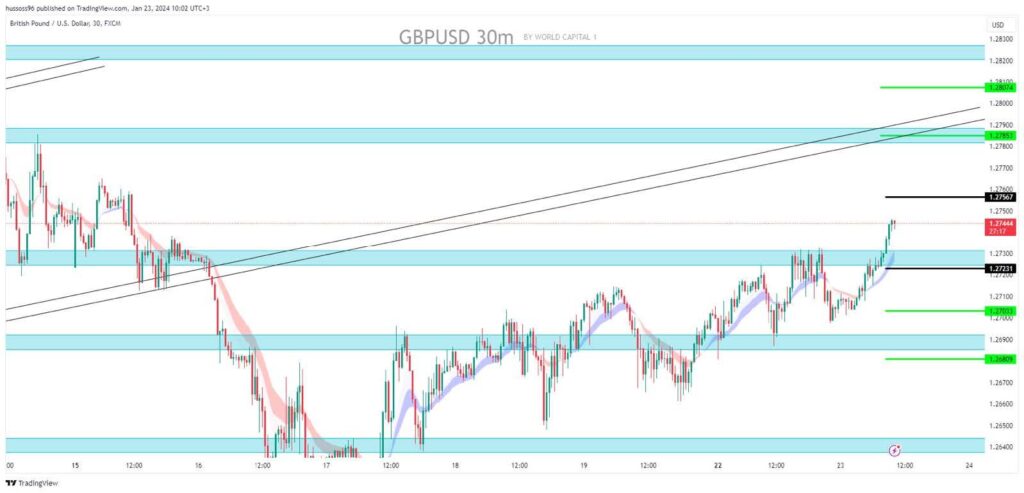
Trend: down
Time interval: half an hour (30 minutes)
Current price: 1.27444
The first scenario: selling the pound to the dollar at a break and holding below the level of 1.27231 with
Targeting the price of 1.27033, then 1.26809. Alternative scenario: Buying the pound with a dollar at a break and holding steady by closing above 1.27567, while targeting the price of 1.27853, then 1.28074.
Comment: Trading below the resistances and averages is likely to fall
NAS100
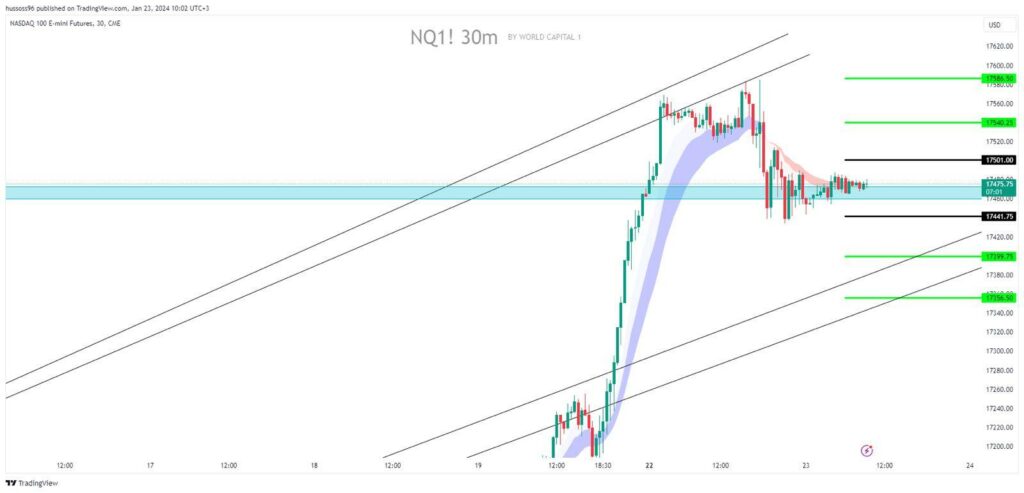
Trend: bullish
Time interval: half an hour (30 minutes)
Current price: 17475
The first scenario: Buy the Nasdaq at a break and hold with a close above 17501, targeting the price of 17540 then 17586. The alternative scenario: Buy the Nasdaq at a break and hold with a close below 17441, targeting the price of 17399 then 17356.
Comment: Trading above the supports and averages is likely to rise
Economic Calendar
(Times are in GMT+3)
- From USA Manufacturing PMI (January) 17:45
- From USA Services PMI (January) 17:45
- Bank of Canada interest rate decision 18:00
- US crude oil inventory 18:30
Fundamental Analysis
- The dollar index fell around 103.2 on Tuesday, and has remained steady so far this week as investors cautiously await key US economic data this week including private sector activity, gross domestic product and personal consumption expenditures inflation numbers.
- Last week, the index rose nearly 1%, as stronger-than-expected US economic data and hawkish signals from Federal Reserve officials dampened expectations for an interest rate cut in March.
- In the Fed’s latest commentary, San Francisco Fed President Mary Daly said on Friday that she believes the US economy and monetary policy are in a “good place” and that it is too early to believe that interest rate cuts are imminent.
- Markets now see less than a 50% chance of a Fed rate cut in March, down significantly from 81% a week ago, according to CME’s FedWatch tool.
- Elsewhere, the Bank of Japan and the European Central Bank will make a monetary policy decision this week.
- Gold prices rose on Tuesday, with the US dollar falling as investors awaited interest rate decisions from a number of central banks and a set of economic data in the United States this week.
- The Bank of Japan kept ultra-low interest rates unchanged in a move that was widely expected.
- The European Central Bank meets on Thursday and is expected to keep monetary policy steady.
- Oil prices today, Tuesday, are volatile and dangerous due to oil rising 2 percent due to supply disruptions in Russia and America, and traders are weighing a group of conflicting concerns about the supply from Russia, with increasing tensions in the Middle East and cold weather problems that disrupt production in the United States.
Risk Disclaimer
Any information/articles/materials/content provided by WRC1 or displayed on its website is intended to be used solely for educational purposes only and does not constitute investment advice or a consultation on how the client should trade.
Although WRC1 has taken care to ensure that the content of such information is accurate, - it cannot be held responsible for any omission/error/miscalculation and cannot guarantee the accuracy of any material or any information contained herein.
Therefore, any reliance you place on such material is strictly at your own risk. Please note that the responsibility for using or relying on such material rests with the client and WRC1 accepts no liability for any loss or damage, including without limitation, any loss of profit which may arise directly or indirectly from the use of or reliance on such information.
Risk Warning: FX/CFDs are complex instruments and carry a high risk of losing money quickly due to leverage. You should consider whether you understand how FX/CFDs work and whether you can afford to take the high risk of losing your money.
You should make sure that, depending on your country of residence, you are allowed to trade with WRC1 products. Please ensure that you are familiar with the company’s risk disclosure.
