 en
enDaily Analysis 16/04/2024
Latest Economic and Fundamental Insights
The dollar index rose for the fifth straight session towards 106.4 on Tuesday, hovering near its highest level in more than five months, as stronger-than-expected US retail sales data boosted bets that the Federal Reserve will delay the start of its easing cycle.
The latest data raised further questions about when the Federal Reserve might start cutting interest rates, after strong job gains in March and a rise in the consumer price index.
Markets now see a 41% chance of the Fed cutting rates in July, compared with around 50% before the data was released, according to the CME FedWatch tool. The probability of the first cut in September has risen to nearly 46%.
“I don’t see any chance of a July cut, assuming we’re all looking at the same data,” said Matt Simpson, senior market analyst at City Index.
In a further confirmation of market bets, San Francisco Fed President Mary Daly said late Monday in the United States that “there is no urgent need” to cut US interest rates.
Gold nears new record high amid rising geopolitical concerns
- Gold hit an all-time high of $2431.29 an ounce on Friday
- Citi expects gold to trade at $3,000 an ounce over the next 6-18 months
- Gold got another boost from the latest round of Middle East headlines, but it was rising even before that with central bank buying and rising inflation expectations also supporting the rally – meaning gold is behaving like an inflation hedge again, City Index. Senior analyst Matt Simpson said.
*”The fact that we’ve seen a break through the day above $2400 is quickly reflected suggesting traders are keen to take profits, which in turn suggests we may be about to experience some kind of shakeout at these elevated levels.”
- Gold rose 1.6% in the previous session despite data showing US retail sales rose more than expected in March.
- The US data raised questions about the chances of interest rate cuts, with the market now betting on fewer than two quarter-point cuts by the end of the year, compared with three cuts about a month ago.
*”The bullion complex has decoupled from US interest rates and the US dollar, suggesting that strong physical demand drivers (e.g., India/China imports, bars/coins), alternative demand, geopolitical hedging, and central bank buying are supporting the market. “,
Asian stocks fall on rethink of US rate cuts and Middle East fears
Escalating tensions in the Middle East and a return to higher US long-term interest rates have dampened risk appetite, sending Asian stocks lower, pushing the dollar to its highest in five months and leaving the fragile yen stuck at levels last seen in 2018. mid-nineties.
Oil prices rise on strong China growth and Middle East tensions to trade Brent crude at $90.00 and West Texas Intermediate crude at $85.00
- The two benchmarks rose on the back of strong economic growth in China, the world’s largest oil importer. Government data showed official GDP grew 5.3% year-on-year in the first quarter, comfortably beating analysts’ expectations.
- While the growth is a welcome sign for policymakers trying to boost confidence, a range of other indicators including property investment, retail sales and industrial production showed that demand remains weak in the face of the protracted property crisis.
- Oil prices rose to their highest since October last week but fell on Monday after Iranian attacks, described by its government as retaliation for an airstrike on its consulate in Damascus, caused only modest damage.
- The price of Bitcoin started another drop from the $67,000 area. BTC is showing bearish signals and may return to the $61,000 support zone soon.
Smart technical reports
How they work
A likely scenario is proposed for today, and the probability of this scenario being achieved, according to technical analysis, may be between 60% and 75%.
If the first scenario fails, the probability of the second scenario being achieved will be between 60% and 75% certain.
The first scenario fails when the price reaches the level of the alternative scenario condition, and the alternative scenario is immediately activated and the prediction from the first scenario is cancelled.
These reports are not considered a substitute for the trader’s decision, but rather they are a tool to assist the follower in making his own decisions, as a reference based on the origins of classical technical analysis.
GOLD
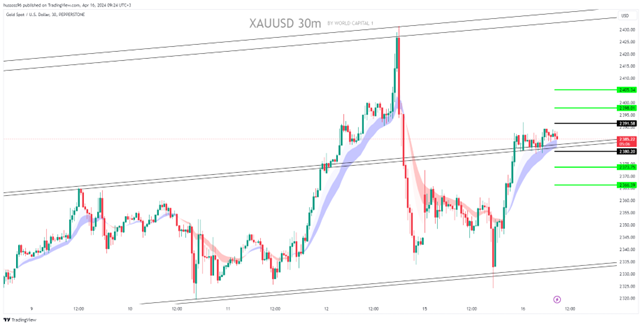
General trend: bullish
Time interval: half an hour (30 minutes)
Current price: 2385.22
The first scenario: Buy gold at a break and hold above 2391.58, with a target price of 2398.01 and 2405.34. Alternative scenario: Sell gold at a break and hold below 2380.20, with a price target of 2373.75 and then 2366.39.
Comment: Trading above supports and averages suggests an upward trend
CRUDE OIL
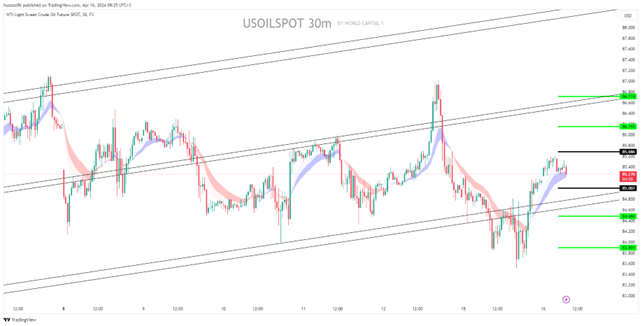
Trend: bullish
Time interval: half an hour (30 minutes)
Current price: $85.27 per barrel
The first scenario: Buying oil at a break and holding steady by closing the candle at the highest level at $85.68, targeting a price of $86.15, then 86.71. Alternative scenario: Selling oil at a break of $85.00, targeting a price of $84.48, then 83.90.
Comment: Trading above supports and averages suggests an upward trend
EURUSD
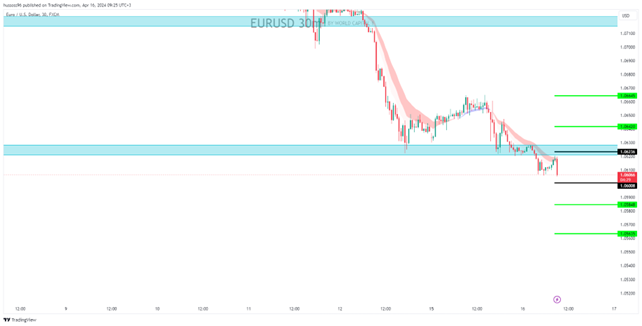
General trend: – Bearish
Time interval: half an hour (30 minutes)
Current price: 1.06066
The first scenario: sell the euro/dollar at a break of 1.06008, targeting a price of 1.05848, then 1.05635. Alternative scenario: buy the euro/dollar at a break of 1.06236, targeting a price of 1.06420, then 1.06645.
Comment: Trading below resistances and averages suggests a decline
GBPUSD
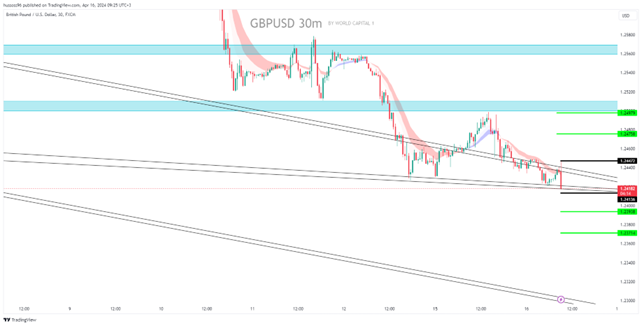
Trend: down
Time interval: half an hour (30 minutes)
Current price: 1.24182
The first scenario: selling the pound dollar at a break and holding below the level of 1.24136, targeting the price of 1.23938 then 1.23714. Alternative scenario: buying the pound dollar at a breaking point and holding steady at a close above 1.24472, targeting the price of 1.24785 then 1.24979.
Comment: Trading below resistances and averages suggests a decline 1.24785
NAS100
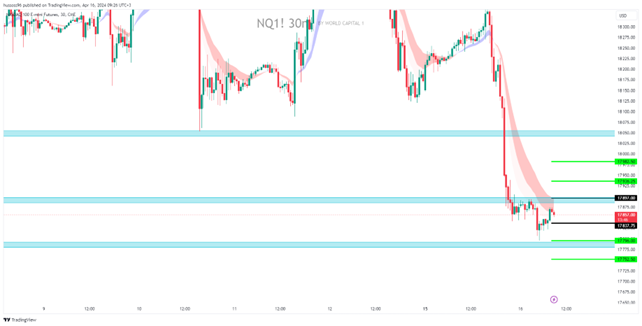
Trend: down
Time interval: half an hour (30 minutes)
Current price: 17857
The first scenario: Selling the Nasdaq at a break and holding steady with a close below 17837, targeting the price of 17796 then 17752. The alternative scenario: Buying the Nasdaq at a break and holding steady with a close above 17897, targeting the price of 17936 then 17982.
Comment: Trading below resistances and averages suggests a decline
Economic Calendar
(Times are in GMT+3)
– Canada CPI (YoY) (Mar) 3:30 PM EDT
– US Federal Reserve Chairman Powell Speech 8:15 PM EDT
– Bank of Canada Governor Macklem Speech 8:15 PM EDT
Fundamental Analysis
The US dollar rose to its highest level in more than five months on Tuesday, as stronger-than-expected US retail sales data boosted bets that the Federal Reserve will delay the start of its easing cycle.
Key Points:
US retail sales rose 0.7% in March, and sales excluding autos rose at the fastest pace in 14 months.
Markets now see the Fed making its first rate cut in September, later than the previously expected June.
The dollar rose to multi-month highs against most major currencies, and reached its highest level in 34 years against the Japanese yen.
Gold prices rose on Tuesday, not far from the record high they hit last week, as concerns about escalating geopolitical tensions between Iran and Israel boosted demand for the safe-haven metal.
Oil prices rose on Tuesday as China’s economy grew at a faster-than-expected pace, while markets remained on edge due to rising tensions in the Middle East after Israel said it would respond to Iran’s weekend missile and drone attack.
Risk Disclaimer
Any information/articles/materials/content provided by WRC1 or displayed on its website is intended to be used solely for educational purposes only and does not constitute investment advice or a consultation on how the client should trade.
Although WRC1 has taken care to ensure that the content of such information is accurate, - it cannot be held responsible for any omission/error/miscalculation and cannot guarantee the accuracy of any material or any information contained herein.
Therefore, any reliance you place on such material is strictly at your own risk. Please note that the responsibility for using or relying on such material rests with the client and WRC1 accepts no liability for any loss or damage, including without limitation, any loss of profit which may arise directly or indirectly from the use of or reliance on such information.
Risk Warning: FX/CFDs are complex instruments and carry a high risk of losing money quickly due to leverage. You should consider whether you understand how FX/CFDs work and whether you can afford to take the high risk of losing your money.
You should make sure that, depending on your country of residence, you are allowed to trade with WRC1 products. Please ensure that you are familiar with the company’s risk disclosure.
