 en
enDaily Analysis 15/01/2024
Latest Economic and Fundamental Insights
- The dollar index fell to around 102.4 on Monday, with trading volumes expected to remain thin throughout the session as most investors were away for the Martin Luther King Jr. holiday.
- Safe-haven gold gains rose as bets on a Federal Reserve rate cut renewed.
- Geopolitical risks are mounting, but developments in the Middle East do not appear to be leading to a decline in oil supplies.
- Oil fell in a potential technical correction after prices settled on Friday at their highest levels in a week, trading at $78 a barrel for Brent and $72 a barrel for West Texas Intermediate.
- Microsoft briefly surpassed $2.87 trillion in market capitalization to topple Apple as the most valuable company in the world.
- Meta shares jumped 3.7% to a two-year high of $370.
- The Nikkei index in Tokyo closed up 0.91%.
- Bitcoin prices rose near the resistance area of $49,000. BTC began to decline sharply and broke through several key support levels at $45,000 to enter a short-term downtrend.
Smart technical reports
How they work
A likely scenario for the day is proposed, and the probability of this scenario being achieved, according to technical analysis, could be between 60% and 75%. If the first scenario fails, the probability of the second scenario being achieved will be between 60% and 75%.
The first scenario fails when the price reaches the alternative scenario condition level, the alternative scenario is then immediately activated, and the first scenario prediction gets cancelled.
These reports are not considered a substitute for the trader’s decision, but rather they are a tool to assist the follower in making their own decisions, as a reference based on classical technical analysis.
GOLD

General trend: bullish
Time interval: 30 minutes
Current price: $1,973.63
First scenario: Buy gold on the break when steady by closing the candle above the level of $2,059.56, targeting a price of $2,064.62 and then $2,071.56.
Alternative scenario: Sell gold on the break of $2,051.33, targeting a price of $2,044.88 and then $2,037.53.
Comment: Trading above the supports and averages suggests an uptrend.
CRUDE OIL
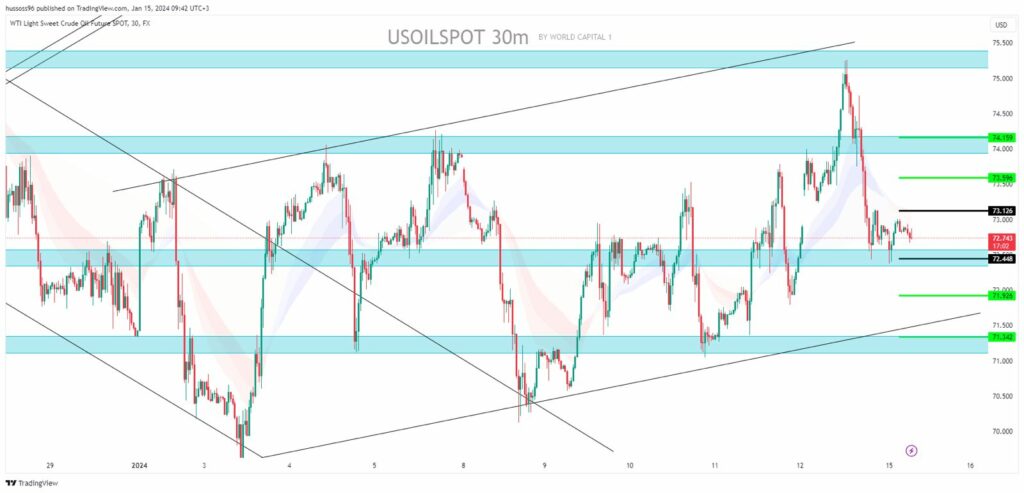
General trend: bullish
Time interval: 30 minutes
Current price: $72.74 per barrel
First scenario: Buy oil at a break of $73.12, targeting a price of $73.59 and then $74.15.
Alternative scenario: Sell oil on the level of $72.44, targeting a price of $71.92 and then $71.34.
Comment: Trading above the supports and averages suggests an uptrend.
EURUSD
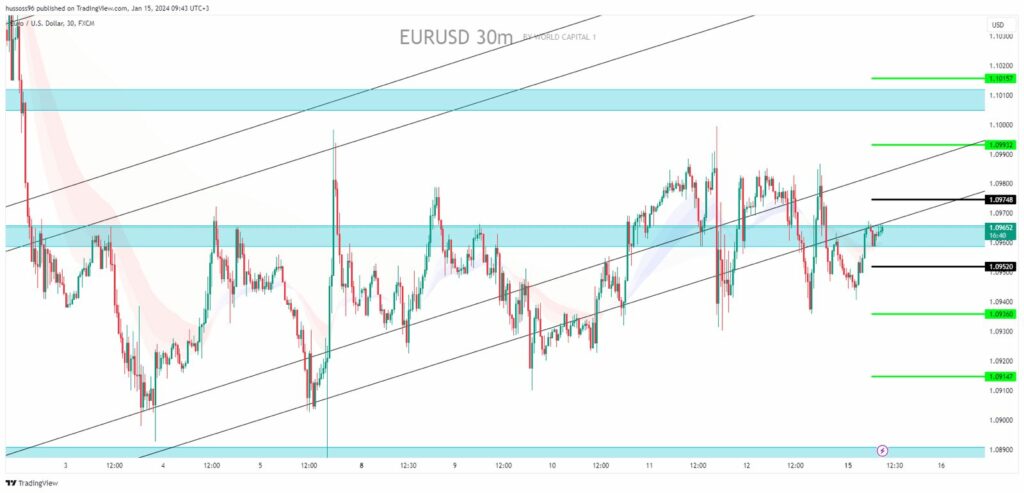
General trend: bullish
Time interval: 30 minutes
Current price: $1.09652
First scenario: Buy EURUSD on the break when steady by closing the candle above the level of $1.09748, targeting a price of $1.09932 and then $1.10157.
Alternative scenario: Sell EURUSD on the break of $1.09520, targeting a price of $1.09360 and then $1.09147.
Comment: Trading above the supports and averages suggests an uptrend.
GBPUSD
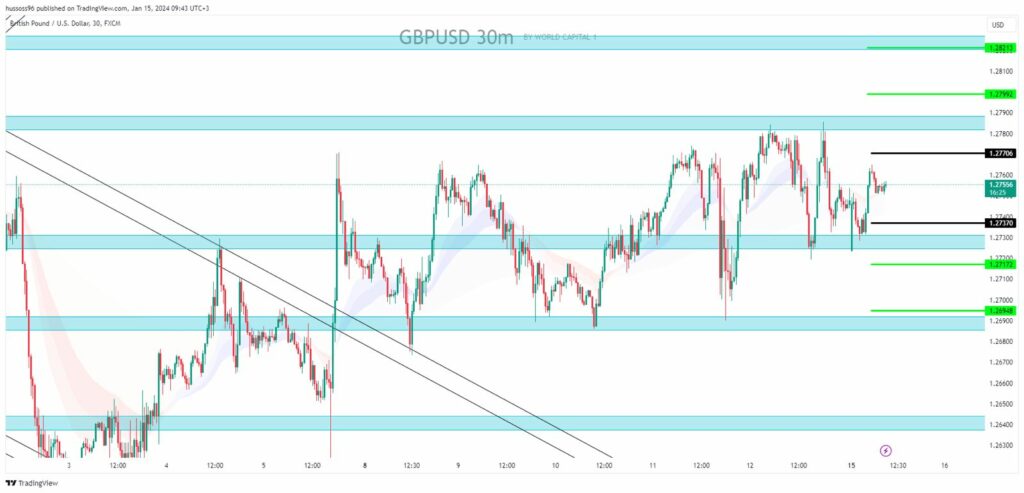
General trend: bullish
Time interval: 30 minutes
Current price: $1.27556
First scenario: Buy GBPUSD on the break when steady by closing the candle above the level of $1.27706, targeting a price of $1.27992 and then $1.28213.
Alternative scenario: Sell GBPUSD on the break of $1.27370, targeting a price of $1.27172 and then $1.26948.
Comment: Trading above the supports and averages suggests an uptrend.
NAS100
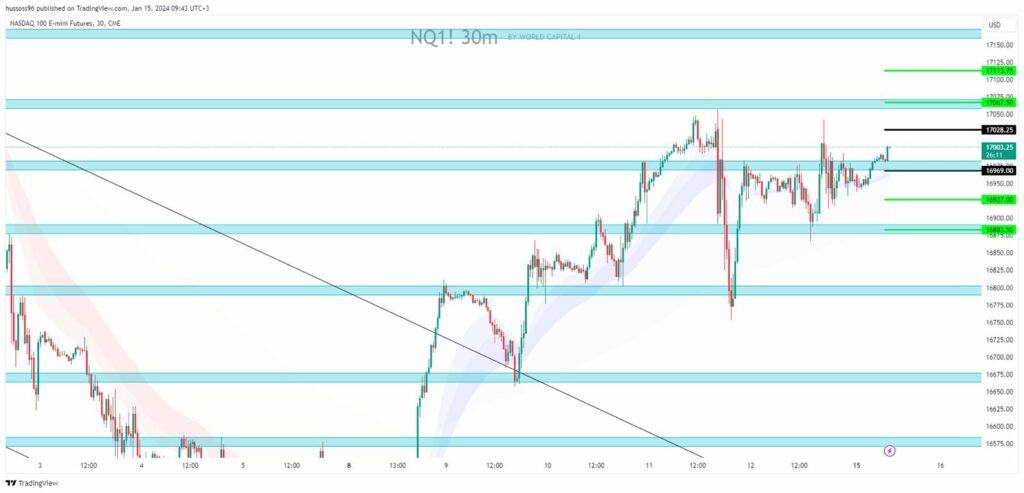
General trend: bullish
Time interval: 30 minutes
Current price: $17,003
First scenario: Buy Nasdaq on the break when steady by closing the candle above the level of $17,028, targeting a price of $17,067 and then $17,113.
Alternative scenario: Sell Nasdaq on the break of $16,969, targeting a price of $16,927 and then $16,883.
Comment: Trading above the supports and averages suggests an uptrend.
Economic Calendar
(Times are in GMT+3)
- U.S.: Martin Luther King Jr. Bank Holiday
Fundamental Analysis
- The dollar index fell to around 102.4 on Monday, as trading volumes were expected to remain thin throughout the session with most investors away for the Martin Luther King Jr. holiday.
- Last week, the dollar ended flat as stronger-than-expected U.S. consumer inflation data was offset by a sudden drop in U.S. producer price inflation figures.
- The latest producer price index report showed an unexpected decline of 0.1% in December, below market expectations for an increase of 0.1%.
- On an annual basis, prices rose 1%, accelerating from 0.8% in the previous month but below the expected rate of 1.3%.
- Meanwhile, data on Thursday showed that the inflation rate rose to 3.4%, above expectations of 3.2%, while the monthly consumer price index rose 0.3%, above expectations of 0.2%.
- Markets still expect a near 80% chance that the Federal Reserve will begin easing monetary policy in March.
- Gold prices rose on Monday, holding above the $2,050 level thanks to safe-haven appeal amid rising tensions in the Middle East and renewed bets on an early rate cut by the U.S. Federal Reserve.
- Overall, traders are betting on 166 basis points of Fed rate cuts this year, up from Friday morning’s bets of 150 basis points.
- Oil is falling in a potential technical correction after prices settled on Friday at their highest levels in a week. While geopolitical risks are mounting, developments in the Middle East do not appear to be leading to a decline in oil supplies, including airstrikes by the U.S.-led coalition against Houthi targets in Yemen. However, the more the escalation in the region, the more the market will need to start pricing in a greater risk of supply disruption.
Risk Disclaimer
Any information/articles/materials/content provided by WRC1 or displayed on its website is intended to be used solely for educational purposes only and does not constitute investment advice or a consultation on how the client should trade.
Although WRC1 has taken care to ensure that the content of such information is accurate, - it cannot be held responsible for any omission/error/miscalculation and cannot guarantee the accuracy of any material or any information contained herein.
Therefore, any reliance you place on such material is strictly at your own risk. Please note that the responsibility for using or relying on such material rests with the client and WRC1 accepts no liability for any loss or damage, including without limitation, any loss of profit which may arise directly or indirectly from the use of or reliance on such information.
Risk Warning: FX/CFDs are complex instruments and carry a high risk of losing money quickly due to leverage. You should consider whether you understand how FX/CFDs work and whether you can afford to take the high risk of losing your money.
You should make sure that, depending on your country of residence, you are allowed to trade with WRC1 products. Please ensure that you are familiar with the company’s risk disclosure.
