 en
enDaily Analysis 12/01/2024
Latest Economic and Fundamental Insights
- The dollar index stabilized around 102.2 on Friday after sharp swings in the previous session, as investors continued to digest stronger-than-expected U.S. consumer inflation data and its implications for monetary policy expectations.
- Gold gains rose as a safe haven amid escalating tensions in the Middle East.
- Markets are focused on the rising geopolitical tensions.
- The release of U.S. producer price index data is scheduled for 16:30.
- Oil prices rose 2% after U.S. and British airstrikes in Yemen, trading at $79 a barrel for Brent and $73 a barrel for West Texas Intermediate.
- Growth data in the UK is positive and beats expectations.
- Inflation data in China shows improvement and comes in better than expected.
- Meta shares jump 3.7% to a two-year high of $370.
- Robert Kiyosaki increases Bitcoin holdings after the SEC approves Bitcoin spot ETFs, now trading above $46,000.
Smart technical reports
How they work
A likely scenario for the day is proposed, and the probability of this scenario being achieved, according to technical analysis, could be between 60% and 75%. If the first scenario fails, the probability of the second scenario being achieved will be between 60% and 75%.
The first scenario fails when the price reaches the alternative scenario condition level, the alternative scenario is then immediately activated, and the first scenario prediction gets cancelled.
These reports are not considered a substitute for the trader’s decision, but rather they are a tool to assist the follower in making their own decisions, as a reference based on classical technical analysis.
GOLD
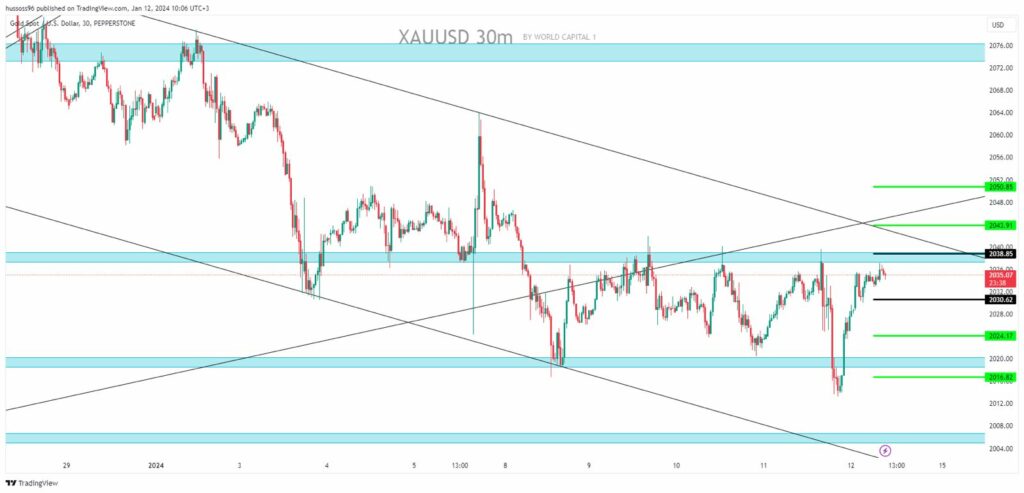
General trend: bearish
Time interval: 30 minutes
Current price: $2,035.07
First scenario: Sell gold on the break of $2,030.62, targeting a price of $2,024.17 and then $2,016.82.
Alternative scenario: Buy gold on the break when steady by closing the candle above the level of $2,038.85, targeting a price of $2,043.91 and then $2,050.85.
Comment: Trading below resistances and averages suggests a downtrend.
CRUDE OIL
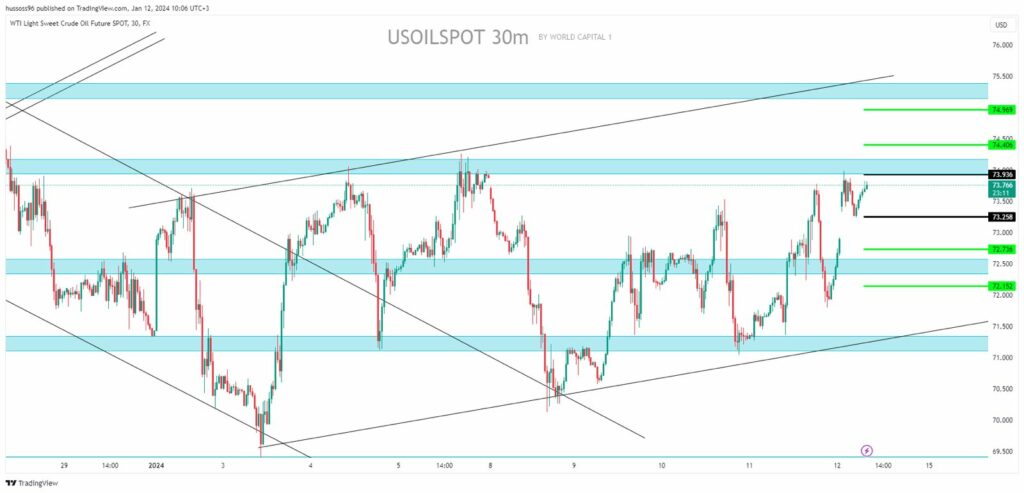
General trend: bullish
Time interval: 30 minutes
Current price: $73.76 per barrel
First scenario: Buy oil at a break of $73.93, targeting a price of $74.40 and then $74.96.
Alternative scenario: Sell oil on the level of $73.25, targeting a price of $72.73 and then $72.15.
Comment: Trading above the supports and averages suggests an uptrend.
EURUSD
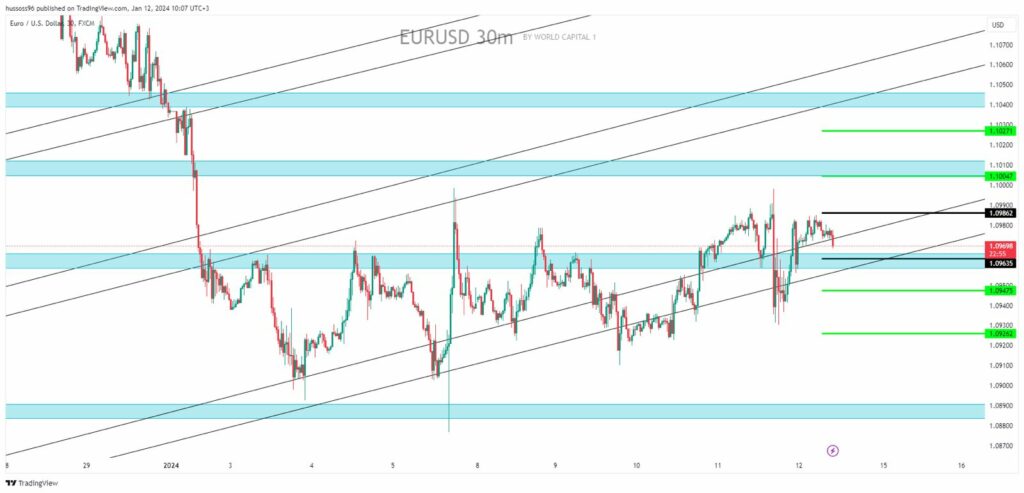
General trend: bullish
Time interval: 30 minutes
Current price: $1.09698
First scenario: Buy EURUSD on the break when steady by closing the candle above the level of $1.09862, targeting a price of $1.10047 and then $1.10271.
Alternative scenario: Sell EURUSD on the break of $1.09635, targeting a price of $1.09475 and then $1.09262.
Comment: Trading above the supports and averages suggests an uptrend.
GBPUSD

General trend: bullish
Time interval: 30 minutes
Current price: $1.27653
First scenario: Buy GBPUSD on the break when steady by closing the candle above the level of $1.27919, targeting a price of $1.28205 and then $1.28227.
Alternative scenario: Sell GBPUSD on the break of $1.27584, targeting a price of $1.27386 and then $1.27162.
Comment: Trading above the supports and averages suggests an uptrend.
NAS100
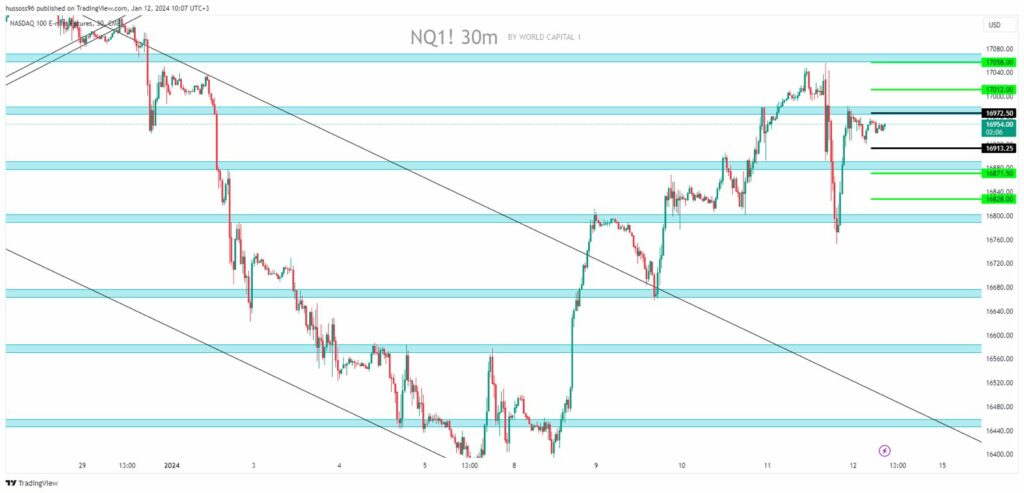
General trend: bullish
Time interval: 30 minutes
Current price: $16,954
First scenario: Buy Nasdaq on the break when steady by closing the candle above the level of $16,972, targeting a price of $17,012 and then $17,058.
Alternative scenario: Sell Nasdaq on the break of $16,913, targeting a price of $16,871 and then $16,828.
Comment: Trading above the supports and averages suggests an uptrend.
Economic Calendar
(Times are in GMT+3)
- U.S.: The Producer Price Index (annually) (December) at 16:30
- U.S.: The Producer Price Index (monthly) (December) at 16:30
Fundamental Analysis
- The dollar index stabilized around 102.2 on Friday after sharp swings in the previous session, as investors continued to digest stronger-than-expected U.S. consumer inflation data and its implications for monetary policy expectations.
- The annual inflation rate rose to 3.4% in December, faster than the expected 3.2%, while the monthly consumer price index showed an increase of 0.3%, beating expectations of 0.2%.
- Cleveland Fed President Loretta Mester said the latest CPI numbers mean it is likely too early to cut interest rates, while Richmond Fed President Thomas Barkin said the data did not do much to clarify the path of inflation.
- However, markets are pricing in a roughly 70% chance that the Federal Reserve will start cutting interest rates in March, down from a near-90% probability just a week ago.
- Investors are now looking to U.S. producer price inflation data on Friday for further guidance.
- Gold prices rose on Friday, as concerns about escalating conflict in the Middle East due to international airstrikes in Yemen boosted the appeal of the yellow metal as a safe haven.
- The United States and Britain launched airstrikes against Houthi-linked sites in Yemen, while Saudi Arabia called for restraint in light of the strikes.
- Data on Thursday showed that the U.S. consumer prices rose more than expected in December, but excluding volatile food and energy costs, the pace of price increases slowed to 3.9% from 4% year-on-year.
- Oil prices jumped more than 2% on Friday after the United States and Britain launched airstrikes against Houthi military targets in Yemen in response to the group’s attacks on shipping in the Red Sea.
Risk Disclaimer
Any information/articles/materials/content provided by WRC1 or displayed on its website is intended to be used solely for educational purposes only and does not constitute investment advice or a consultation on how the client should trade.
Although WRC1 has taken care to ensure that the content of such information is accurate, - it cannot be held responsible for any omission/error/miscalculation and cannot guarantee the accuracy of any material or any information contained herein.
Therefore, any reliance you place on such material is strictly at your own risk. Please note that the responsibility for using or relying on such material rests with the client and WRC1 accepts no liability for any loss or damage, including without limitation, any loss of profit which may arise directly or indirectly from the use of or reliance on such information.
Risk Warning: FX/CFDs are complex instruments and carry a high risk of losing money quickly due to leverage. You should consider whether you understand how FX/CFDs work and whether you can afford to take the high risk of losing your money.
You should make sure that, depending on your country of residence, you are allowed to trade with WRC1 products. Please ensure that you are familiar with the company’s risk disclosure.
