 en
enDaily Analysis 11/01/2024
Latest Economic and Fundamental Insights
- The dollar index fell to about 102.2 on Thursday, its second consecutive decline, as investors awaited key U.S. inflation data that could influence expectations for the Federal Reserve’s monetary policy.
- Gold rose as the dollar weakened ahead of U.S. inflation data.
- The U.S. Consumer Price Index is due to be released at 16:30.
- Bearish investors are treading carefully ahead of the release of key U.S. economic data.
- Oil prices rose amid rising tensions in the Middle East, trading at $77 a barrel for Brent and $72 a barrel for West Texas Intermediate.
- The market is on edge after the attacks on ships in the Red Sea.
- Amazon is reportedly planning to cancel hundreds of new jobs.
- Asian stocks rose ahead of the release of the U.S. Consumer Price Index, with the Nikkei index breaking through the 35,000 level.
- SEC approves issuance of Bitcoin spot ETFs. The U.S. Securities and Exchange Commission has approved the issuance of 11 exchange-traded funds for Bitcoin spot contracts.
Smart technical reports
How they work
A likely scenario for the day is proposed, and the probability of this scenario being achieved, according to technical analysis, could be between 60% and 75%. If the first scenario fails, the probability of the second scenario being achieved will be between 60% and 75%.
The first scenario fails when the price reaches the alternative scenario condition level, the alternative scenario is then immediately activated, and the first scenario prediction gets cancelled.
These reports are not considered a substitute for the trader’s decision, but rather they are a tool to assist the follower in making their own decisions, as a reference based on classical technical analysis.
GOLD
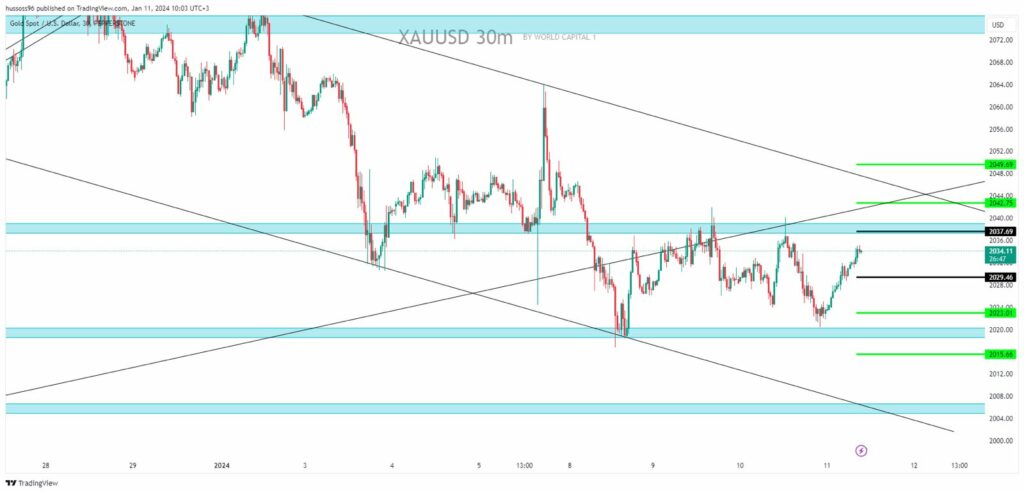
General trend: bearish
Time interval: 30 minutes
Current price: $2,034.11
First scenario: Sell gold on the break of $2,029.36, targeting a price of $2,023.01 and then $2,015.66.
Alternative scenario: Buy gold on the break when steady by closing the candle above the level of $2,037.69, targeting a price of $2,042.75 and then $2,049.69.
Comment: Trading below resistances and averages suggests a downtrend.
CRUDE OIL
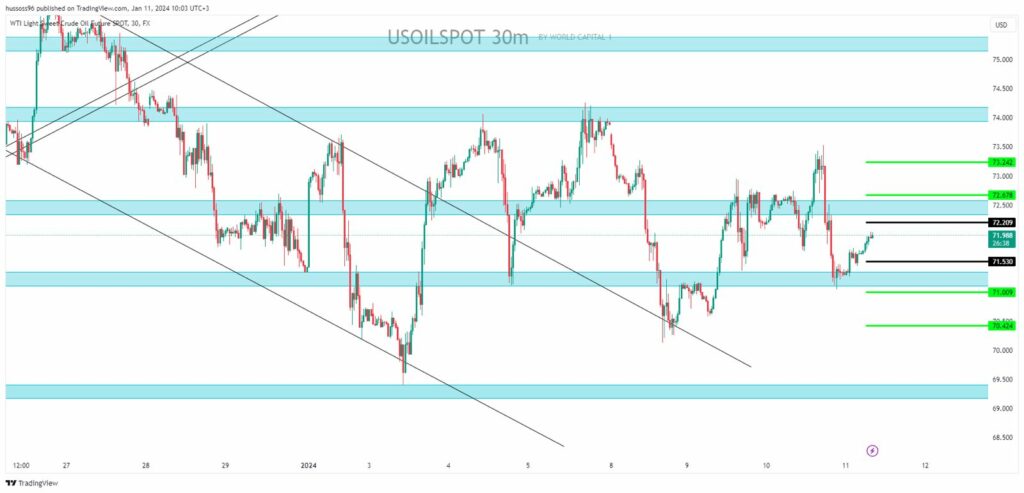
General trend: bullish
Time interval: 30 minutes
Current price: $71.98 per barrel
First scenario: Buy oil at a break of $72.20, targeting a price of $72.67 and then $73.24.
Alternative scenario: Sell oil on the level of $71.53, targeting a price of $71.00 and then $70.42.
Comment: Trading above the supports and averages suggests an uptrend.
EURUSD
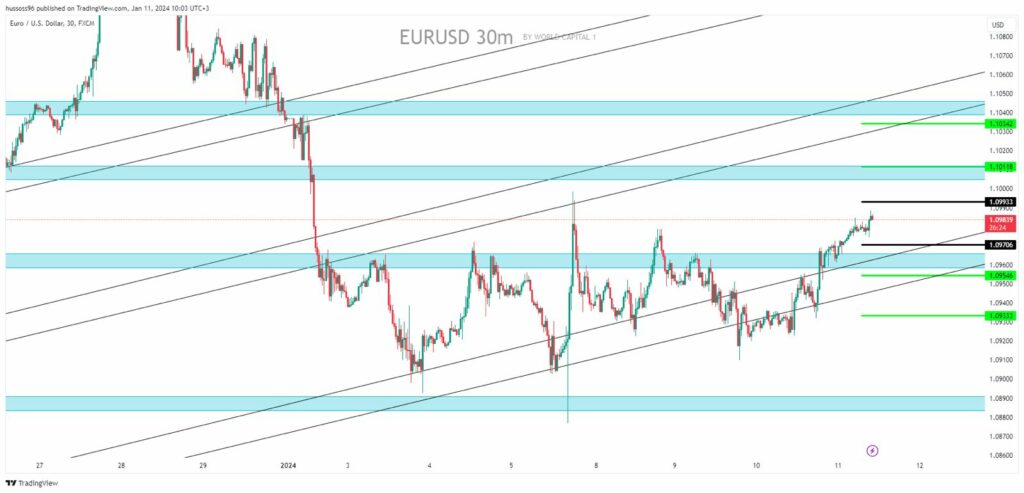
General trend: bullish
Time interval: 30 minutes
Current price: $1.05751
First scenario: Buy EURUSD on the break when steady by closing the candle above the level of $1.09933, targeting a price of $1.10118 and then $1.10342.
Alternative scenario: Sell EURUSD on the break of $1.09706, targeting a price of $1.09546 and then $1.08333.
Comment: Trading above the supports and averages suggests an uptrend.
GBPUSD
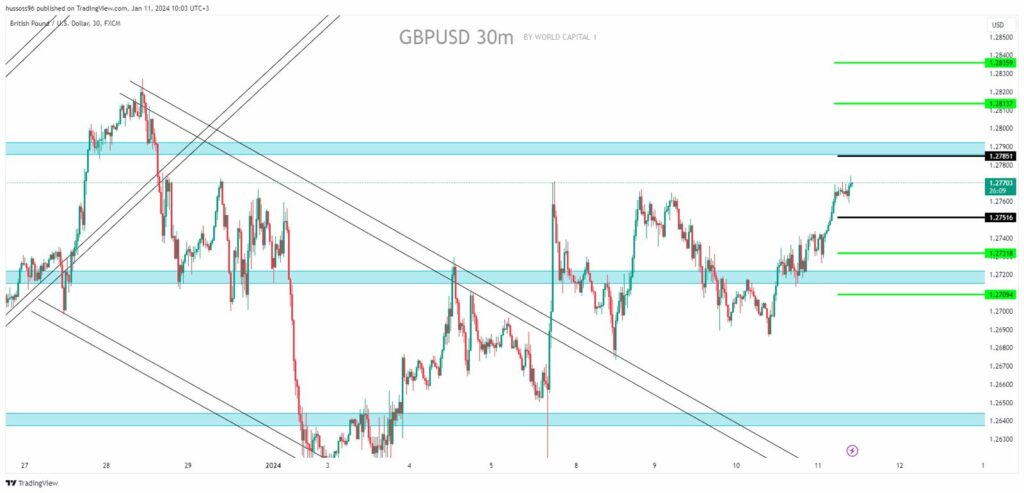
General trend: bullish
Time interval: 30 minutes
Current price: $1.27703
First scenario: Buy GBPUSD on the break when steady by closing the candle above the level of $1.27851, targeting a price of $1.28137 and then $1.28359.
Alternative scenario: Sell GBPUSD on the break of $1.27516, targeting a price of $1.27318 and then $1.27094.
Comment: Trading above the supports and averages suggests an uptrend.
NAS100
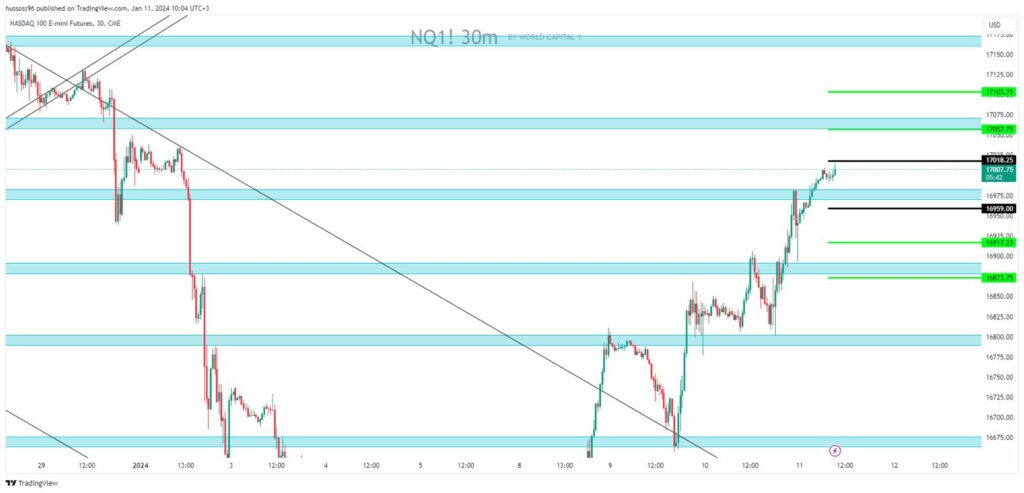
General trend: bullish
Time interval: 30 minutes
Current price: $17,007
First scenario: Buy Nasdaq on the break when steady by closing the candle above the level of $17,018, targeting a price of $17,057 and then $17,103.
Alternative scenario: Sell Nasdaq on the break of $16,959, targeting a price of $16,917 and then $16,973.
Comment: Trading above the supports and averages suggests an uptrend.
Economic Calendar
(Times are in GMT+3)
- U.S.: The U.S. Consumer Price Index (Core CPI) (December) at 16:30
- U.S.: The U.S. Consumer Price Index (CPI) (year-over-year) (December) at 16:30
- U.S.: The U.S. Consumer Price Index (CPI) (monthly) (December) at 16:30
- U.S.: The U.S. Initial Jobless Claims at 16:30
Fundamental Analysis
- The dollar index fell to about 102.2 on Thursday, its second consecutive decline, as investors awaited key U.S. inflation data that could influence expectations for the Federal Reserve’s monetary policy.
- Markets expect headline inflation to rise to 3.1% in December, while core inflation is expected to fall to 3.8%, the lowest level since May 2021.
- Traders see a roughly 64% chance that the Federal Reserve will begin quantitative easing in March, down from a near-90% probability just a week ago.
- Some analysts have pointed to May as being more likely to be the start of a tightening cycle, as the U.S. labor market remains tight and inflation remains above the central bank’s 2% target.
- New York Federal Reserve President John Williams also said on Wednesday that it is still too early to call for a rate cut, as the central bank still has a long way to go to bring inflation back to 2%.
- Oil prices rose on Thursday amid concerns about escalating conflict in the Middle East, with further attacks on Gaza and on shipping in the Red Sea, even as a surprise increase in U.S. crude stockpiles capped gains.
- Gold prices continued to rise on Thursday as the U.S. dollar continued to decline ahead of the U.S. inflation report later in the day, which could provide more clarity on the Federal Reserve’s monetary policy outlook this year.
Risk Disclaimer
Any information/articles/materials/content provided by WRC1 or displayed on its website is intended to be used solely for educational purposes only and does not constitute investment advice or a consultation on how the client should trade.
Although WRC1 has taken care to ensure that the content of such information is accurate, - it cannot be held responsible for any omission/error/miscalculation and cannot guarantee the accuracy of any material or any information contained herein.
Therefore, any reliance you place on such material is strictly at your own risk. Please note that the responsibility for using or relying on such material rests with the client and WRC1 accepts no liability for any loss or damage, including without limitation, any loss of profit which may arise directly or indirectly from the use of or reliance on such information.
Risk Warning: FX/CFDs are complex instruments and carry a high risk of losing money quickly due to leverage. You should consider whether you understand how FX/CFDs work and whether you can afford to take the high risk of losing your money.
You should make sure that, depending on your country of residence, you are allowed to trade with WRC1 products. Please ensure that you are familiar with the company’s risk disclosure.
