 en
enDaily Analysis 09/01/2024
Latest Economic and Fundamental Insights
- The dollar index fell to around 102.1 on Tuesday, ending its recent rally as investors remained on the sidelines ahead of key U.S. inflation data this week, which could provide clues on the Federal Reserve’s upcoming policy moves.
- Gold rebounded from a three-week low as the dollar weakened.
- The Federal Reserve Bank of New York sees inflation falling in the future.
- U.S. interest rates have a 62% chance of a rate cut in March.
- Investors are awaiting U.S. inflation data on Thursday.
- Crude oil prices fell as Saudi Arabia cut selling prices for February, trading at $76.00 a barrel for Brent and $70.00 a barrel for West Texas Intermediate.
- Retail sales in Australia grew at the fastest pace in two years.Federal Reserve member: Inflation could fall without further rate hikes.
- Bitcoin rose 7% to hit $47,000. This rally comes as excitement surrounding Bitcoin investment funds has risen. If the listing of a Bitcoin fund is not announced on Wednesday, we could see a sharp decline in Bitcoin.
Smart technical reports
How they work
A likely scenario for the day is proposed, and the probability of this scenario being achieved, according to technical analysis, could be between 60% and 75%. If the first scenario fails, the probability of the second scenario being achieved will be between 60% and 75%.
The first scenario fails when the price reaches the alternative scenario condition level, the alternative scenario is then immediately activated, and the first scenario prediction gets cancelled.
These reports are not considered a substitute for the trader’s decision, but rather they are a tool to assist the follower in making their own decisions, as a reference based on classical technical analysis.
GOLD
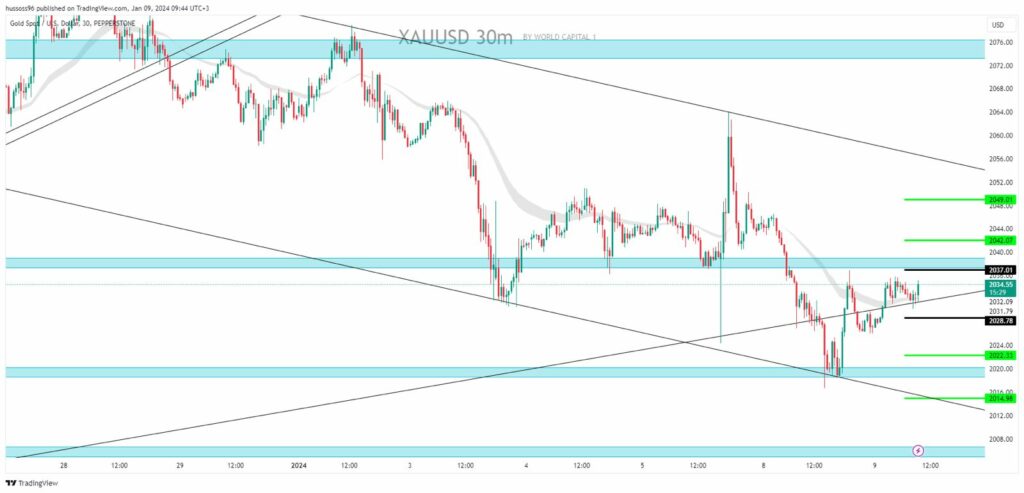
General trend: bearish
Time interval: 30 minutes
Current price: $2,034.55
First scenario: Sell gold on the break of $2,028.78, targeting a price of $2,022.33 and then $2,014.98.
Alternative scenario: Buy gold on the break when steady by closing the candle above the level of $2,037.01, targeting a price of $2,042.07 and then $2,049.01.
Comment: Trading below resistances and averages suggests a downtrend.
CRUDE OIL
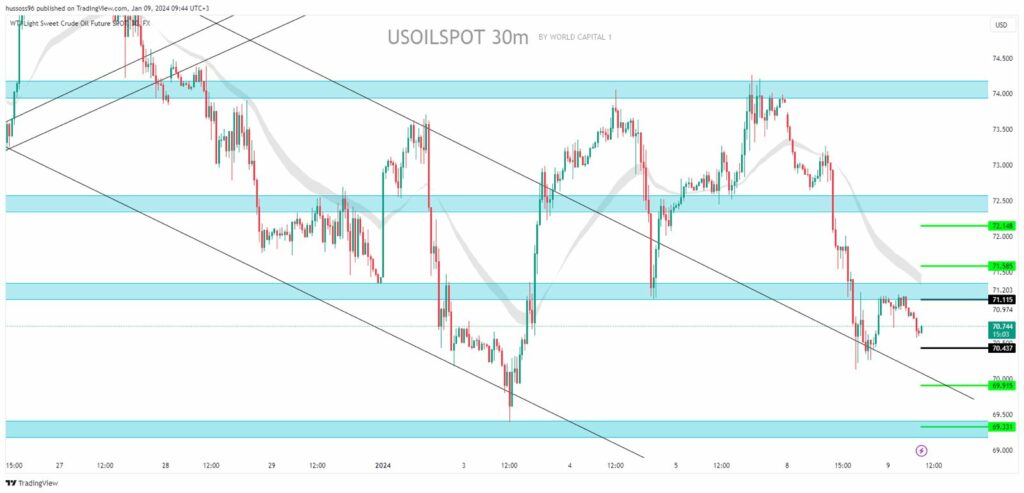
General trend: bearish
Time interval: 30 minutes
Current price: $70.74 per barrel
First scenario: Sell oil on the level of $70.43, targeting a price of $69.91 and then $69.33.
Alternative scenario: Buy oil at a break of $71.11, targeting a price of $71.58 and then $72.14.
Comment: Trading below resistances and averages suggests a downtrend.
EURUSD
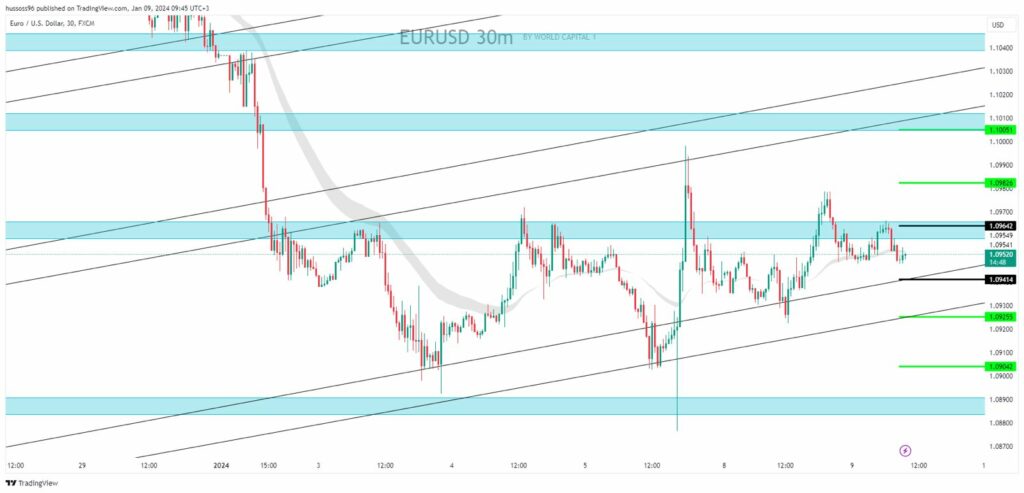
General trend: bullish
Time interval: 30 minutes
Current price: $1.09520
First scenario: Buy EURUSD on the break when steady by closing the candle above the level of $1.09642, targeting a price of $1.09826 and then $1.10051.
Alternative scenario: Sell EURUSD on the break of $1.09414, targeting a price of $1.09255 and then $1.09042.
Comment: Trading above the supports and averages suggests an uptrend.
GBPUSD
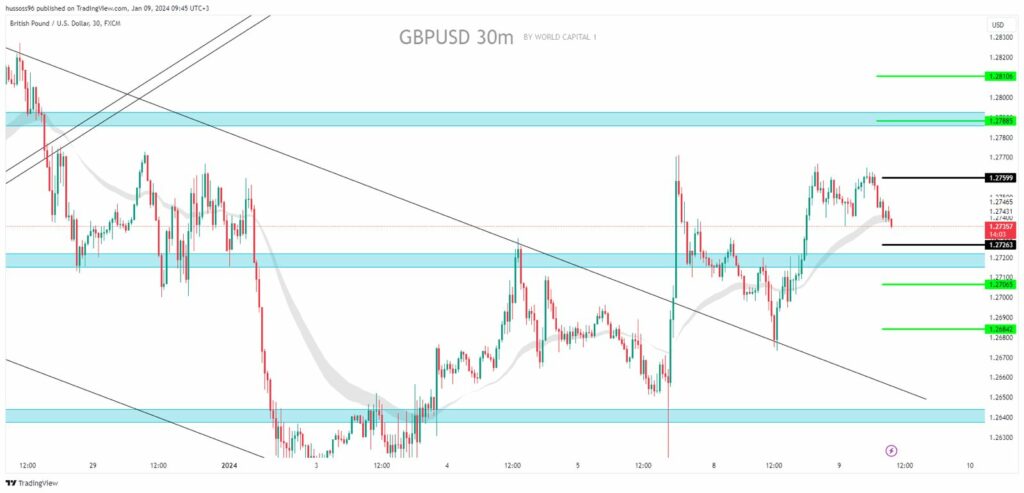
General trend: bullish
Time interval: 30 minutes
Current price: $1.27357
First scenario: Buy GBPUSD on the break when steady by closing the candle above the level of $1.27599, targeting a price of $1.27885 and then $1.28108.
Alternative scenario: Sell GBPUSD on the break of $1.27263, targeting a price of $1.27065 and then $1.26842.
Comment: Trading above the supports and averages suggests an uptrend.
NAS100
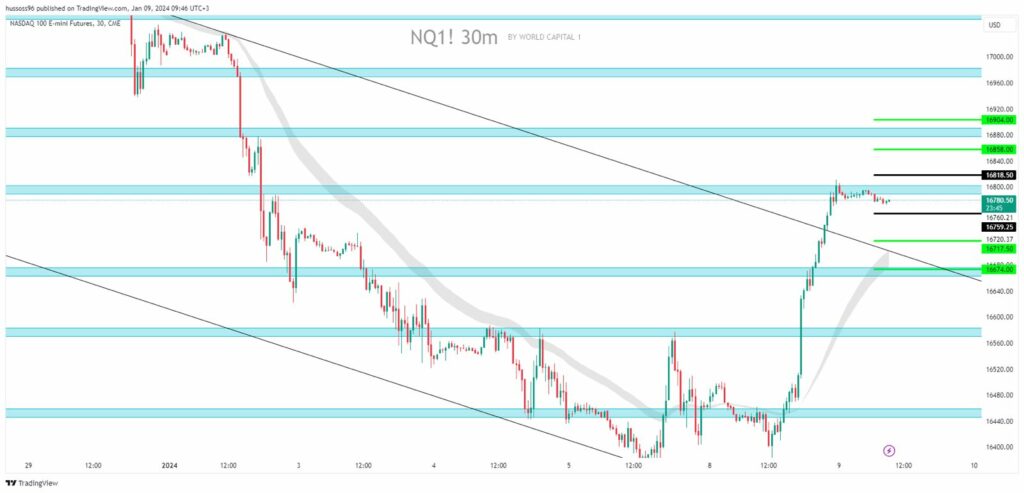
General trend: bullish
Time interval: 30 minutes
Current price: $16,780
First scenario: Buy Nasdaq on the break when steady by closing the candle above the level of $16,818, targeting a price of $16,858 and then $16,904.
Alternative scenario: Sell Nasdaq on the break of $16,759, targeting a price of $16,717 and then $16,674.
Comment: Trading above the supports and averages suggests an uptrend.
Economic Calendar
(Times are in GMT+3)
- US: The trade balance on the US dollar at 16:30
Fundamental Analysis
- The dollar index fell to around 102.1 on Tuesday, ending its recent rally as investors remained on the sidelines ahead of key U.S. inflation data this week, which could provide clues on the Federal Reserve’s upcoming policy moves.
- The decline in the dollar was also due to a rebound in risky assets, particularly in stocks, amid strong expectations that U.S. central banks will implement a series of interest rate cuts this year.
- On the data front, the latest survey by the Federal Reserve Bank of New York of consumer expectations showed that U.S. short-term consumer inflation expectations fell to their lowest level in nearly three years for December.
- Meanwhile, data from last week showed that the U.S. economy added 216,000 jobs in December, beating expectations of 170,000 jobs, as labor markets remained resilient despite tightening financial conditions.
- Gold prices rose on Tuesday from their lowest level in three weeks, supported by weakness in the dollar after a U.S. government report showed that consumers expect inflation to fall, which boosted hopes for a rate cut by the Federal Reserve.
- West Texas Intermediate crude futures settled at $71 a barrel on Tuesday after losing more than 4% in the previous session, weighed down by signs of weakening market fundamentals as highlighted by price cuts in Saudi Arabia.
- Saudi Arabia announced a cut of $2 to $1.50 a barrel above the benchmark for its main Arab Light crude for Asia in February, to the lowest level in 27 months.
- Analysts also pointed to rising global oil supplies from OPEC members and non-members, particularly the United States. However, rising geopolitical tensions in the Middle East and recent supply disruptions in Libya provided some support.
- Investors are now looking to the U.S. Energy Information Administration’s Short-Term Energy Outlook report on Tuesday for new insights into supply and demand conditions.
Risk Disclaimer
Any information/articles/materials/content provided by WRC1 or displayed on its website is intended to be used solely for educational purposes only and does not constitute investment advice or a consultation on how the client should trade.
Although WRC1 has taken care to ensure that the content of such information is accurate, - it cannot be held responsible for any omission/error/miscalculation and cannot guarantee the accuracy of any material or any information contained herein.
Therefore, any reliance you place on such material is strictly at your own risk. Please note that the responsibility for using or relying on such material rests with the client and WRC1 accepts no liability for any loss or damage, including without limitation, any loss of profit which may arise directly or indirectly from the use of or reliance on such information.
Risk Warning: FX/CFDs are complex instruments and carry a high risk of losing money quickly due to leverage. You should consider whether you understand how FX/CFDs work and whether you can afford to take the high risk of losing your money.
You should make sure that, depending on your country of residence, you are allowed to trade with WRC1 products. Please ensure that you are familiar with the company’s risk disclosure.
