 en
enDaily Analysis 08/02/2024
Latest Economic and Fundamental Insights
- The dollar index hovered around 104 on Thursday after falling for two consecutive sessions, as investors parsed the latest comments from Federal Reserve officials to gauge interest rate expectations.
- Gold steadies as hawkish Fed comments counter safe-haven demand
- Fed hesitant to cut rates until more confident on inflation
- Five more Fed speakers due to speak this week
- Regional U.S. bank worries resurface after Moody’s downgrade
- Palladium prices hit 5-year low on demand worries from industry
- Oil rises on slow progress in Gaza peace talks, weak dollar; Brent at $79.00, WTI at $74.00
- Walt Disney reports better-than-expected first-quarter earnings as media giant cuts costs while revenue stagnates
- Alibaba revenue misses estimates but raises share buyback program by $25 billion
- Alibaba stock jumps 4% in premarket trading after raising share buyback program by $25 billion
- Uber Q4 23 earnings:
- Gross bookings: $37.58 billion (est. $37.12 billion)
- Gross bookings guidance for Q1: $37 billion to $38.5 billion (est. $37.26 billion)
- Snap, the company that owns Snapchat, reports strong quarterly earnings but revenue misses expectations
- Earnings per share: 8 cents per share vs. 6 cents expected
- Revenue: $1.36 billion vs. $1.38 billion expected
- Chinese stocks continue to rise, Nikkei hits fresh highs
- Bitcoin (BTC) rose above $44,000 on Wednesday to hit a new four-week high amid increased accumulation of Bitcoin by large holders and new all-time highs in US stock indices.
Smart technical reports
How they work
A likely scenario is proposed for today, and the probability of this scenario being achieved, according to technical analysis, may be between 60% and 75%.
If the first scenario fails, the probability of the second scenario being achieved will be between 60% and 75% certain.
The first scenario fails when the price reaches the level of the alternative scenario condition, and the alternative scenario is immediately activated and the prediction from the first scenario is cancelled.
These reports are not considered a substitute for the trader’s decision, but rather they are a tool to assist the follower in making his own decisions, as a reference based on the origins of classical technical analysis.
GOLD
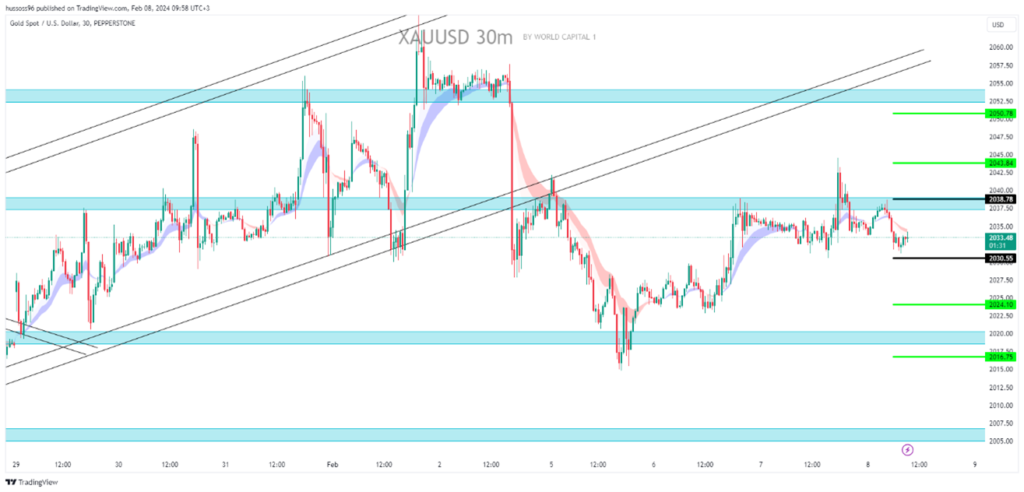
- General trend: bearish
- Time interval: half an hour (30 minutes)
- Current price: 2033.48
- The first scenario: Selling gold at a fraction and holding below 2030.55, with a target price of 2024.10 and 2016.75. Alternative scenario: Buying gold at a break and holding above 2038.78, with a price targeting of 2043.84 and then 2050.78.
- Comment: Trading below resistances and averages suggests a decline
CRUDE OIL
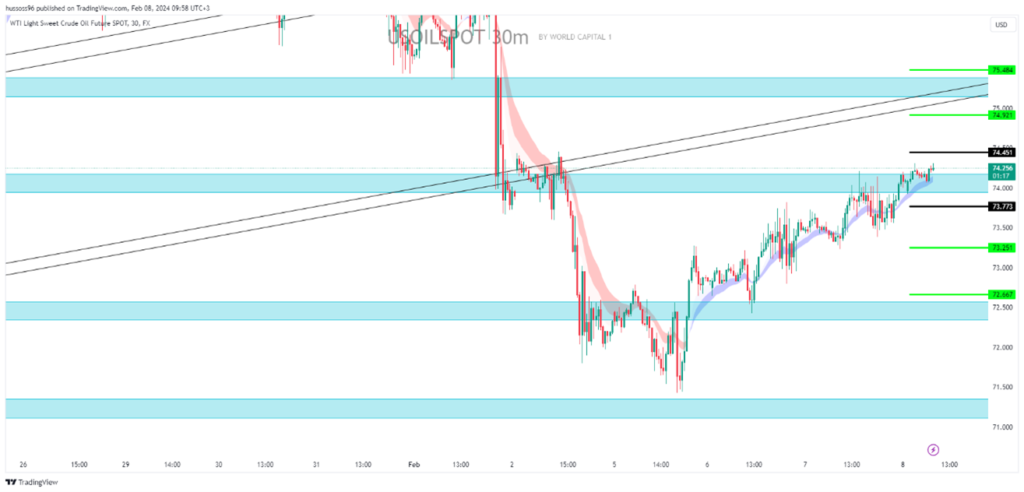
- Trend: bearish
- Time interval: half an hour (30 minutes)
- Current price: $74.25 per barrel
- The first scenario: selling oil at a break and holding steady by closing the candle below the $73.77 level, targeting a price of $73.25, then 72.66. Alternative scenario: buying oil at a break of the $74.45 level, targeting a price of $74.92, then 75.48.
- Comment: Trading below resistances and averages suggests a decline
EURUSD
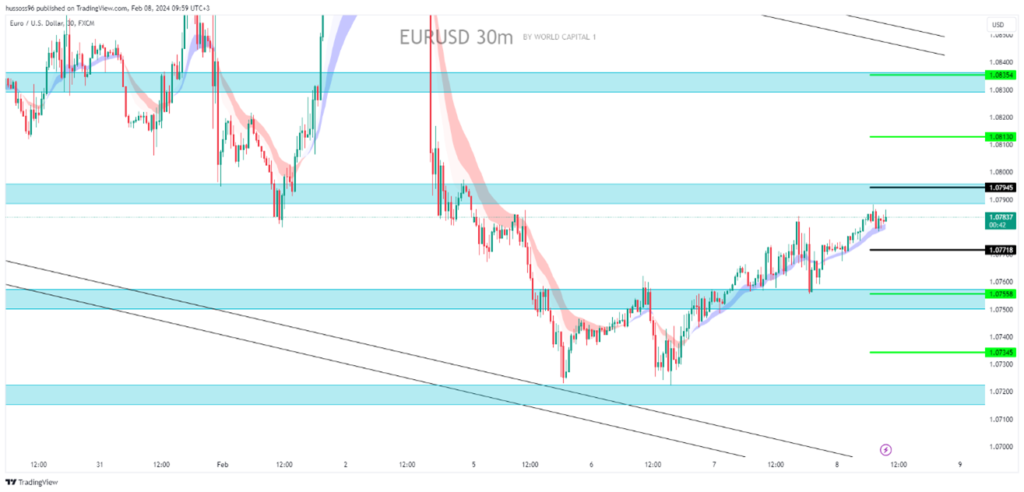
- General trend: – Bearish
- Time interval: half an hour (30 minutes)
- Current price: 1.07837 scenario
- First: Sell the Euro/Dollar at a break of 1.07718, targeting a price of 1.07558, then 1.07345. Alternative scenario: Buy the Euro/Dollar at a break of 1.07945, targeting a price of 1.08130, then 1.08354.
- Comment: Trading below resistances and averages suggests a decline
GBPUSD
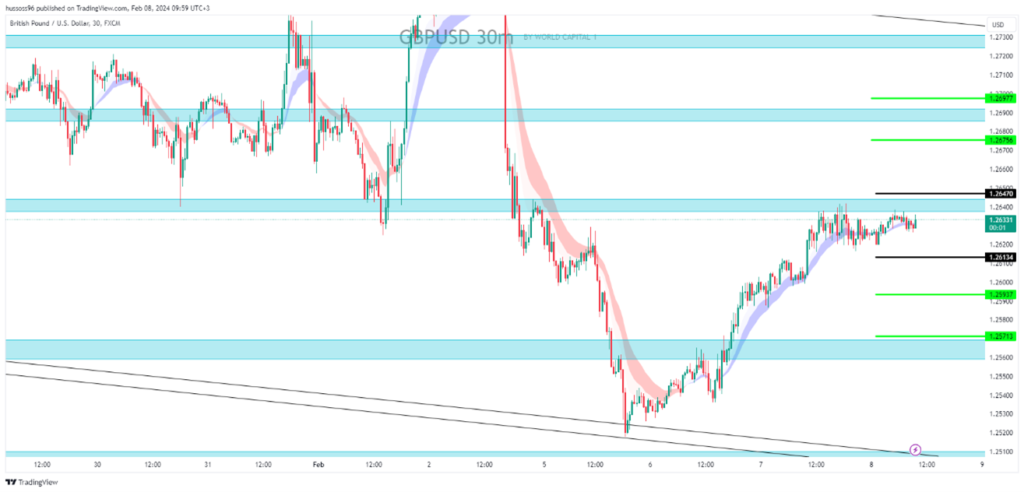
- Trend: Bearish break
- Time: half an hour (30 minutes)
- Current price: 1.26331
- The first scenario: selling the pound dollar at a fraction and holding below the level of 1.26134, targeting the price of 1.25937, then 1.25713. Alternative scenario: buying the pound dollar at a break, and holding steady by closing above 1.26470, targeting the price of 1.26756, then 1.26977.
- Comment: Trading below resistances and averages leads to a decline
NAS100
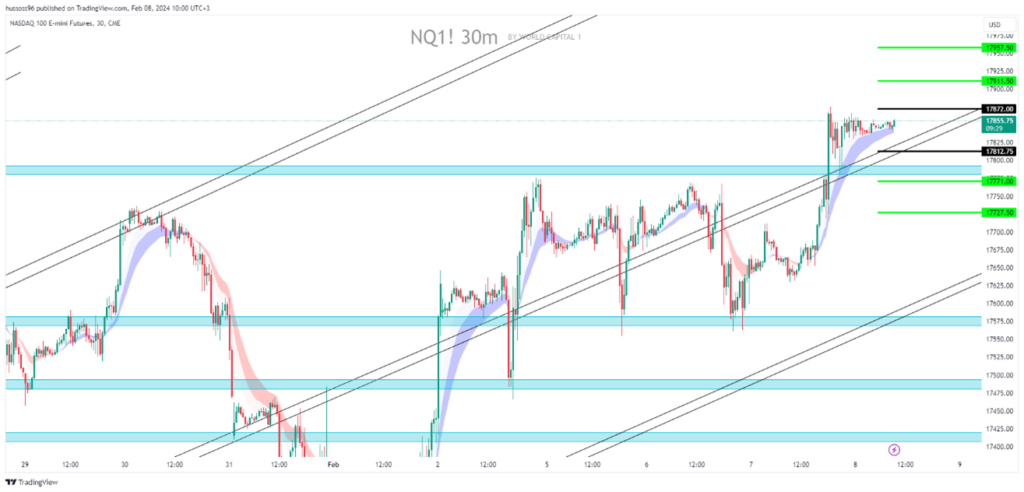
- Trend: bullish
- Time interval: half an hour (30 minutes)
- Current price: 17855 First scenario: Buy Nasdaq at a break and hold with a close above 17872, targeting the price of 17911 then 17957 Alternative scenario: Sell Nasdaq at a break and hold with a close below 17812 targeting a price of 17771 then 17727
- Comment: Trading above supports and averages suggests an upward trend.
Economic Calendar
(Times are in GMT+3)
- Initial unemployment claims 16:30
Fundamental Analysis
- The dollar index hovered around 104 on Thursday after falling for two consecutive sessions, as investors parsed the latest comments from Federal Reserve officials to gauge interest rate expectations.
- Boston Fed President Susan Collins said the central bank is carefully assessing incoming data and evolving expectations as policy remains well-positioned, adding that it would be appropriate to start to taper policy later in the year.
- Markets currently price in less than a 20% chance of a Federal rate cut in March, down significantly from the two-thirds chance seen at the start of the year.
- Investors are now looking ahead to weekly jobless claims data on Thursday for a gauge on the health of the labor market.
- The dollar has nursed recent losses against most other major currencies, but it has remained firm against the Japanese yen.
- Gold prices steadied on Thursday as hawkish comments from U.S. Federal Reserve officials dampened market hopes for early rate cuts, which reduced demand for the safe-haven metal after Israel rejected a Hamas ceasefire offer amid ongoing talks to end the Gaza conflict.
- Oil extended gains on Thursday after Israel rejected a ceasefire offer made by Hamas, while a weaker dollar also supported prices.
- Middle East tensions have kept the market on edge since October with limited progress in talks to end the Gaza conflict.
Risk Disclaimer
Any information/articles/materials/content provided by WRC1 or displayed on its website is intended to be used solely for educational purposes only and does not constitute investment advice or a consultation on how the client should trade.
Although WRC1 has taken care to ensure that the content of such information is accurate, - it cannot be held responsible for any omission/error/miscalculation and cannot guarantee the accuracy of any material or any information contained herein.
Therefore, any reliance you place on such material is strictly at your own risk. Please note that the responsibility for using or relying on such material rests with the client and WRC1 accepts no liability for any loss or damage, including without limitation, any loss of profit which may arise directly or indirectly from the use of or reliance on such information.
Risk Warning: FX/CFDs are complex instruments and carry a high risk of losing money quickly due to leverage. You should consider whether you understand how FX/CFDs work and whether you can afford to take the high risk of losing your money.
You should make sure that, depending on your country of residence, you are allowed to trade with WRC1 products. Please ensure that you are familiar with the company’s risk disclosure.
