 en
enDaily Analysis 08/01/2024
Latest Economic and Fundamental Insights
- The dollar index stabilized around 102.4 on Monday after seeing sharp volatility in the previous session, as investors looked to U.S. inflation data later this week for further clues on the Federal Reserve’s monetary policy outlook.
- Gold prices fell as investors focused on U.S. inflation data.
- U.S. Consumer Price Index data is due out on Thursday.
- Oil prices fell by more than 1% as Saudi price cuts overcame Middle East concerns to trade at $77.00 a barrel for Brent and $72.00 a barrel for WTI.
- The People’s Bank of China set the dollar/yuan rate at 7.1006.
- India reports about 619 cases of the new strain of the coronavirus.
- Bitcoin price is still struggling to break above resistance levels of $44,500 and $44,700. BTC is showing some bearish signals and could decline towards $42,150.
Smart technical reports
How they work
A likely scenario for the day is proposed, and the probability of this scenario being achieved, according to technical analysis, could be between 60% and 75%. If the first scenario fails, the probability of the second scenario being achieved will be between 60% and 75%.
The first scenario fails when the price reaches the alternative scenario condition level, the alternative scenario is then immediately activated, and the first scenario prediction gets cancelled.
These reports are not considered a substitute for the trader’s decision, but rather they are a tool to assist the follower in making their own decisions, as a reference based on classical technical analysis.
GOLD
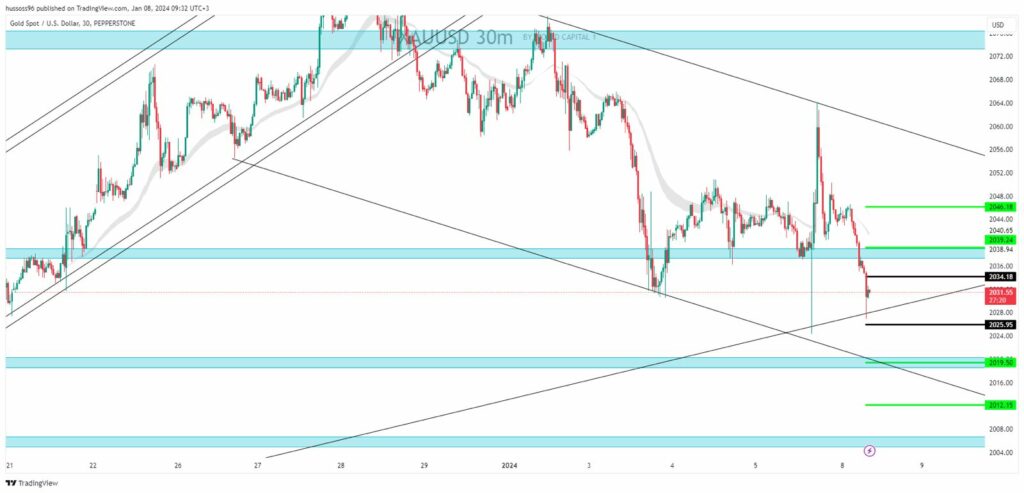
General trend: bearish
Time interval: 30 minutes
Current price: $2,031.55
First scenario: Sell gold on the break of $2,025.95, targeting a price of $2,019.50 and then $2,012.15.
Alternative scenario: Buy gold on the break when steady by closing the candle above the levels of $2,034.18, targeting a price of $2,039.24 and then $2,046.18.
Comment: Trading below resistances and averages suggests a downtrend.
CRUDE OIL
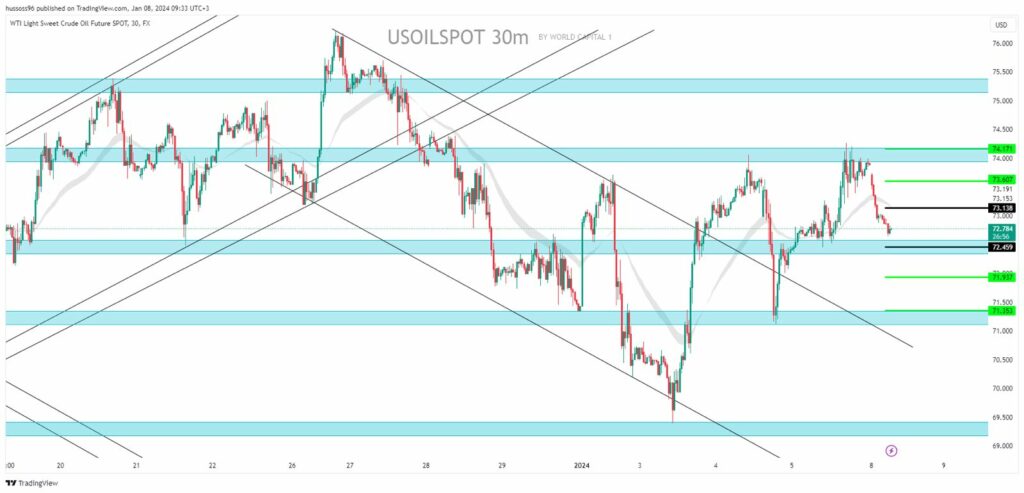
General trend: bullish
Time interval: 30 minutes
Current price: $72.78 per barrel
First scenario: Buy oil at a break of $73.13, targeting a price of $73.60 and then $74.17.
Alternative scenario: Sell oil on the level of $72.45, targeting a price of $71.93 and then $71.35.
Comment: Trading above the supports and averages suggests an uptrend.
EURUSD
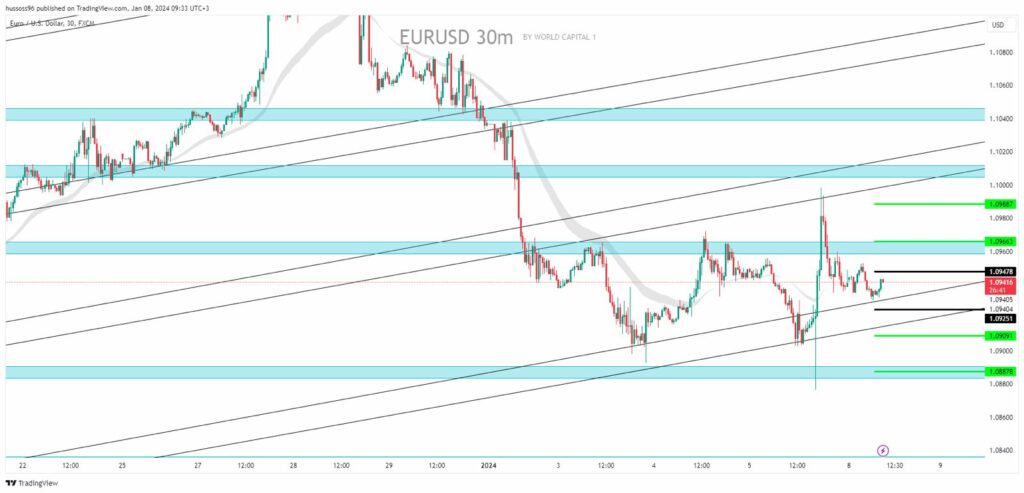
General trend: bullish
Time interval: 30 minutes
Current price: $1.09416
First scenario: Buy EURUSD on the break when steady by closing the candle above the levels of $1.09478, targeting a price of $1.09663 and then $1.09887.
Alternative scenario: Sell EURUSD on the break of $1.09261, targeting a price of $1.09091 and then $1.08878.
Comment: Trading above the supports and averages suggests an uptrend.
GBPUSD
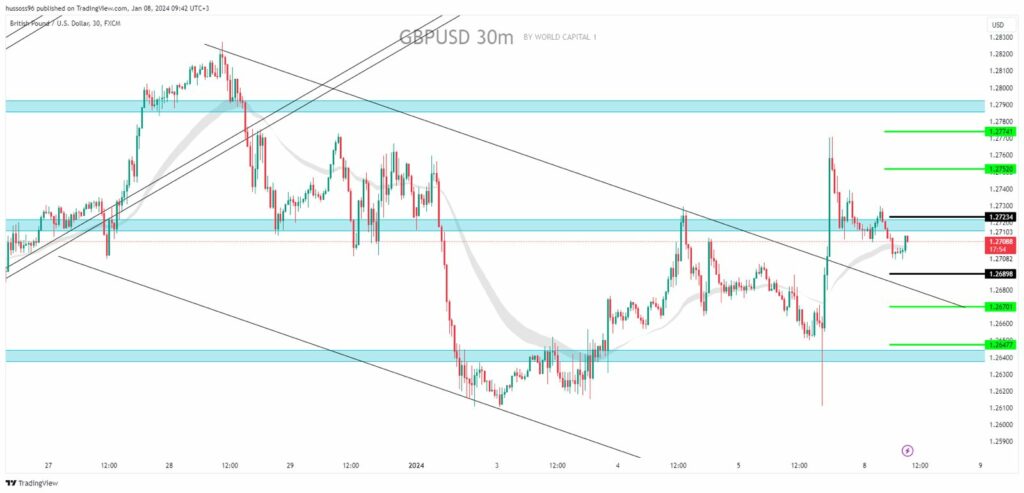
General trend: bullish
Time interval: 30 minutes
Current price: $1.27088
First scenario: Buy GBPUSD on the break when steady by closing the candle above the level of $1.27234, targeting a price of $1.27520 and then $1.27741.
Alternative scenario: Sell GBPUSD on the break of $1.26898, targeting a price of $1.26701 and then $1.26477.
Comment: Trading above the supports and averages suggests an uptrend.
NAS100
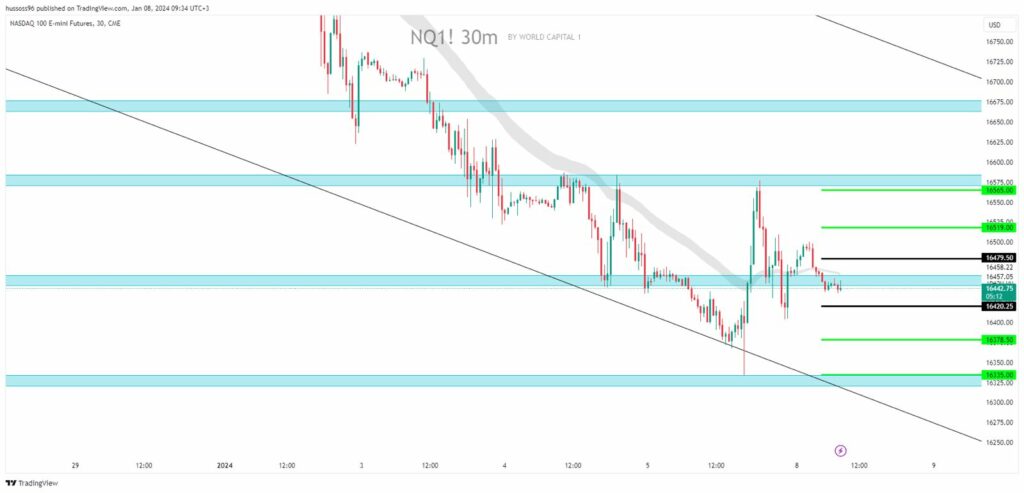
General trend: bearish
Time interval: 30 minutes
Current price: $16,442
First scenario: Sell Nasdaq on the break of $16,420, targeting a price of $16,378 and then $16,335.
Alternative scenario: Buy Nasdaq on the break when steady by closing the candle above the level of $16,479, targeting a price of $16,519 and then $16,565.
Comment: Trading below resistances and averages suggests a downtrend.
Economic Calendar
(Times are in GMT+3)
- Japan: Respect for the Aged Day (Japanese bank holiday)
Fundamental Analysis
- The dollar index settled around 102.4 on Monday after facing severe fluctuations in the previous session, as investors look forward to the U.S. inflation data later this week for more clues on the monetary policy outlook of the Federal Reserve.
- The dollar jumped about 1% last week, reflecting a recovery in Treasury yields, as traders scaled back their expectations for early and sharp interest rate cuts from the Federal Reserve.
- Markets are pricing in a roughly 60% chance of a Federal Reserve rate cut in March, down from nearly 90% seen a week ago.
- Data released on Friday also showed that the U.S. economy added 216,000 jobs in December, beating expectations of 170,000 jobs, as labor markets remained resilient despite tightening financial conditions.
- At the same time, a private survey showed that U.S. services activity slowed sharply in the month.
- Gold prices fell on Monday as fading expectations for an early rate cut in the United States kept the dollar and bond yields supported ahead of a key inflation reading due later this week.
- Official data showed that U.S. employers added more workers than expected in December, but separate data from the Institute for Supply Management (ISM) indicated that the services sector slowed sharply last month.
- Market participants are pricing in a roughly 64% chance of a rate cut by the U.S. central bank in March.
- Oil prices fell more than 1% on Monday on the back of sharp price cuts from Saudi Arabia, the world’s top oil exporter, and increased production by OPEC, which dispelled concerns about rising geopolitical tensions in the Middle East.
Risk Disclaimer
Any information/articles/materials/content provided by WRC1 or displayed on its website is intended to be used solely for educational purposes only and does not constitute investment advice or a consultation on how the client should trade.
Although WRC1 has taken care to ensure that the content of such information is accurate, - it cannot be held responsible for any omission/error/miscalculation and cannot guarantee the accuracy of any material or any information contained herein.
Therefore, any reliance you place on such material is strictly at your own risk. Please note that the responsibility for using or relying on such material rests with the client and WRC1 accepts no liability for any loss or damage, including without limitation, any loss of profit which may arise directly or indirectly from the use of or reliance on such information.
Risk Warning: FX/CFDs are complex instruments and carry a high risk of losing money quickly due to leverage. You should consider whether you understand how FX/CFDs work and whether you can afford to take the high risk of losing your money.
You should make sure that, depending on your country of residence, you are allowed to trade with WRC1 products. Please ensure that you are familiar with the company’s risk disclosure.
