 en
enDaily Analysis 05/02/2024
Latest Economic and Fundamental Insights
- The dollar index rises above 104 on Monday, hitting its highest level in eight weeks as US economic resilience and hawkish signals from the Federal Reserve dampen sentiment on rate cuts.
- Gold retreats as jobs data dials back bets on US rate cuts
- Gold speculators cut net longs for the fourth week
- US nonfarm payrolls rise more than expected – Friday’s data
- Investors await speeches from a slew of Fed speakers this week
- Oil rises on US plans for more Middle East strikes, Ukraine hits Russian refinery, with Brent crude trading at $77.00 and WTI crude at $72.00
- US Treasury yields track their global peers higher as bets on Fed rate cuts recede
- Japan’s Nikkei rises on Monday, helped by a weaker yen and gains on Wall Street late last week
- Bitcoin struggles to continue its rise above the $43,800 resistance level. The cryptocurrency is moving down and could fall sharply if it breaks the $41,800 support level.
Smart technical reports
How they work
A likely scenario is proposed for today, and the probability of this scenario being achieved, according to technical analysis, may be between 60% and 75%.
If the first scenario fails, the probability of the second scenario being achieved will be between 60% and 75% certain.
The first scenario fails when the price reaches the level of the alternative scenario condition, and the alternative scenario is immediately activated and the prediction from the first scenario is cancelled.
These reports are not considered a substitute for the trader’s decision, but rather they are a tool to assist the follower in making his own decisions, as a reference based on the origins of classical technical analysis.
GOLD
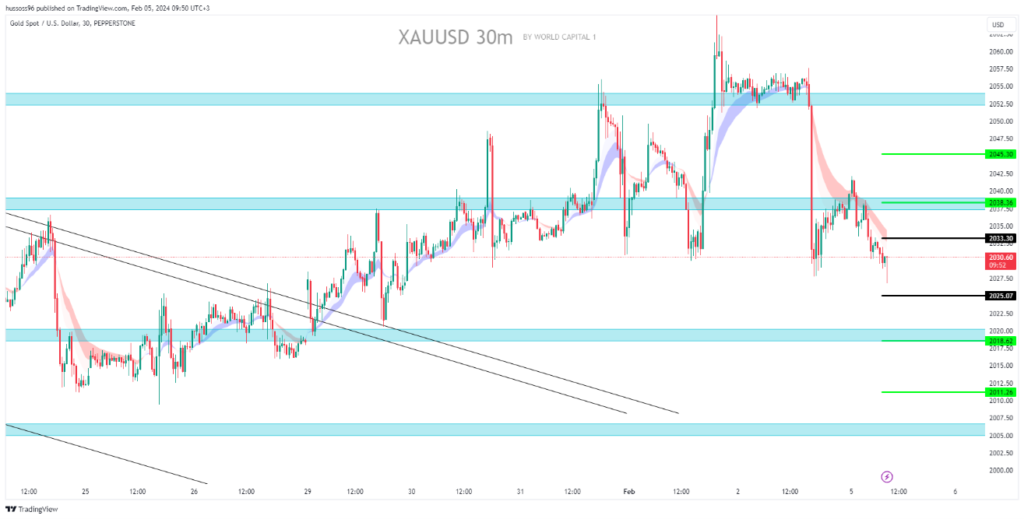
General trend: bullish
Time interval: half an hour (30 minutes)
Current price: 2030.60
The first scenario: Buy gold at a fraction and hold above 2033.30, with a target price of 2038.36 and 2045.30. Alternative scenario: Sell gold at a break and hold below 2025.07, with a target price of 2018.62 and then 2011.26.
Comment: Trading above supports and averages suggests an upward trend.
CRUDE OIL
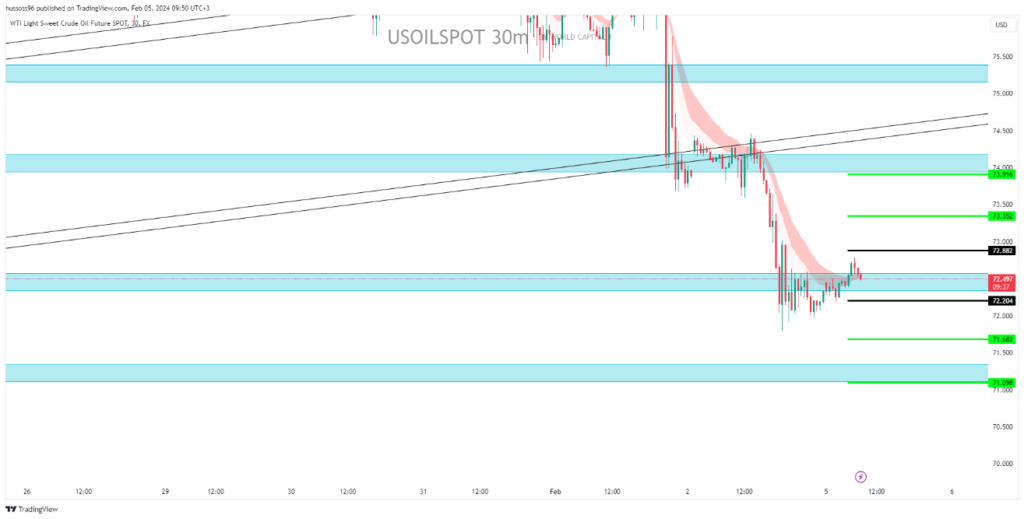
Trend: bearish
Time interval: half an hour (30 minutes)
Current price: $72.49 per barrel
The first scenario: selling oil at a break and holding steady by closing the candle below the $72.20 level, targeting a price of $71.68, then 71.09. Alternative scenario: buying oil at a break of the $72.88 level, targeting a price of $73.35, then 73.91.
Comment: Trading below resistances and averages suggests a decline
EURUSD
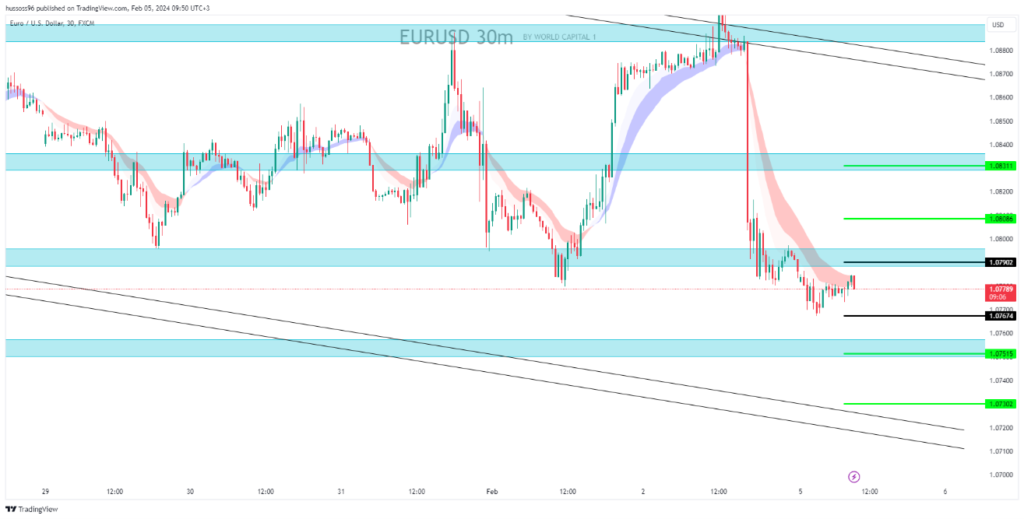
General trend: – Bearish
Time interval: half an hour (30 minutes)
Current price: 1.07789 scenario
First: Sell the Euro/Dollar at a break of 1.07674, targeting a price of 1.07515, then 1.07302. Alternative scenario: Buy the Euro/Dollar at a break of 1.07902, targeting a price of 1.08086, then 1.08311.
Comment: Trading below resistances and averages suggests a decline
GBPUSD
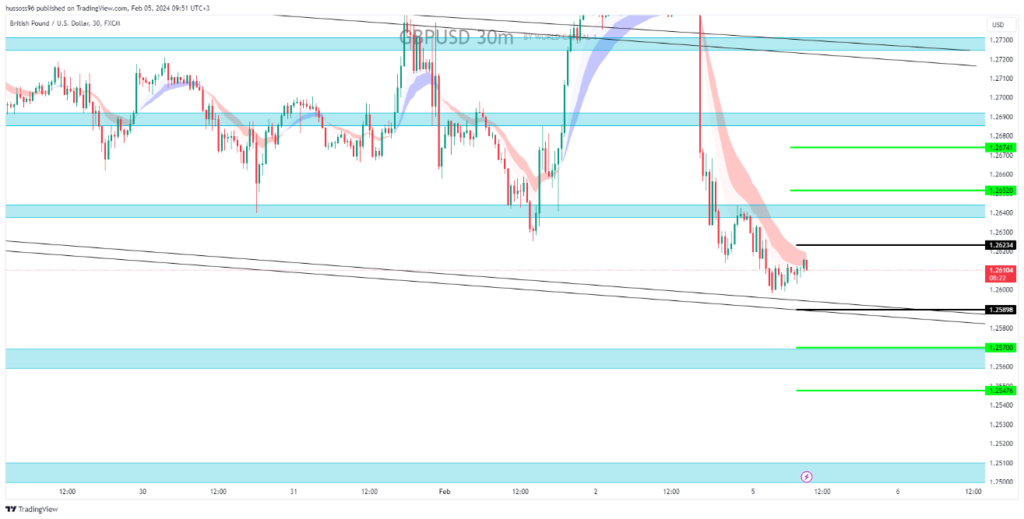
Trend: down
Time interval: half an hour (30 minutes)
Current price: 1.26104 The first scenario: Selling the pound for dollars at a fraction and holding below the level of 1.25898, targeting the price of 1.25700 then 1.25476. Alternative scenario: Buying the pound for dollars at a fraction and holding at a close above 1.26234, targeting the price of 1.26520 then 1.26741.
Comment: Trading below resistances and averages leads to a decline
NAS100
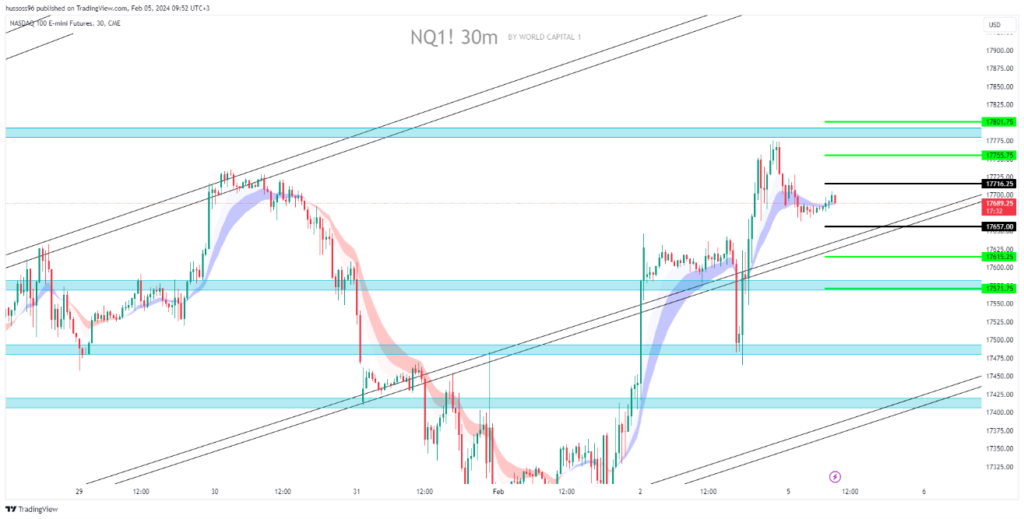
Trend: bullish
Time interval: half an hour (30 minutes)
Current price: 17689
The first scenario: Buying Nasdaq at a break and holding steady with a close above 17716, targeting a price of 17755 then 17801. Alternative scenario: Selling Nasdaq at a break and holding steady with a close below 17657, targeting a price of 17615 then 17571.
Comment: Trading above supports and averages suggests an upward trend.
Economic Calendar
(Times are in GMT+3)
- From the United States of America Services PMI (January) 17:45
- From the United States of America, non-manufacturing purchasing managers’ index issued by the Institute for Supply Management (ISM) (January) 18:00
Fundamental Analysis
- The dollar index rose above 104 on Monday, hitting its highest level in eight weeks as US economic resilience and hawkish signals from the Federal Reserve dampened sentiment on rate cuts.
- Data released on Friday showed that the US economy added 353,000 jobs in January, accelerating from an upwardly revised 333,000 rise in December and far exceeding market expectations of a 180,000 advance.
- Federal Reserve Chair Jerome Powell also vowed in an interview with “60 Minutes” that aired Sunday that the central bank will be “cautious” about cutting rates this year and will wait for more evidence that inflation is moving sustainably to 2%.
- He added that the Fed is likely to move at a much slower pace than the market is expecting.
- Traders have now slashed their bets on a March rate cut to just 20% and see around 137 basis points of total easing this year, down from 150 basis points at the end of last year.
- Gold prices fell on Monday as the dollar and Treasury yields rose after the US jobs report crushed near-term rate cut expectations from the Federal Reserve.
- West Texas Intermediate crude futures steadied above $72 a barrel on Monday after sharp declines last week as investors continued to monitor developments in the Middle East. Last week, oil prices fell by more than 7%, as progress in ceasefire talks between Israel and Hamas eased concerns about supply disruptions from the region.
- Fading expectations of an immediate rate cut by the US Federal Reserve and lingering concerns about the economic recovery in China also weighed on global demand prospects.
- Meanwhile, the United States said it will carry out more military action against Iranian-backed groups, raising tensions in the Middle East even as it insisted it does not seek a wider conflict in the region.
Risk Disclaimer
Any information/articles/materials/content provided by WRC1 or displayed on its website is intended to be used solely for educational purposes only and does not constitute investment advice or a consultation on how the client should trade.
Although WRC1 has taken care to ensure that the content of such information is accurate, - it cannot be held responsible for any omission/error/miscalculation and cannot guarantee the accuracy of any material or any information contained herein.
Therefore, any reliance you place on such material is strictly at your own risk. Please note that the responsibility for using or relying on such material rests with the client and WRC1 accepts no liability for any loss or damage, including without limitation, any loss of profit which may arise directly or indirectly from the use of or reliance on such information.
Risk Warning: FX/CFDs are complex instruments and carry a high risk of losing money quickly due to leverage. You should consider whether you understand how FX/CFDs work and whether you can afford to take the high risk of losing your money.
You should make sure that, depending on your country of residence, you are allowed to trade with WRC1 products. Please ensure that you are familiar with the company’s risk disclosure.
