 en
enDaily Analysis 05/01/2024
Latest Economic and Fundamental Insights
- The dollar index held steady around 102.5 on Friday and is on track for its best week since July, as traders scaled back their bets on early and sharp interest rate cuts from the Federal Reserve this year.
- Gold is headed for its first weekly decline in four weeks; U.S. jobs data in focus.
- Markets are pricing in a 65% chance of a Federal Reserve rate cut in March.
- U.S. non-farm payroll data is due at 4:30 p.m. ET.
- Oil prices rose on comments from the Federal Reserve about inflation and tensions in the Middle East. Brent crude traded at $78 a barrel and West Texas Intermediate at $72 a barrel.
- Japanese stocks turned green thanks to upbeat economic data.
- Taming inflation with rising energy prices and geopolitical conflicts is already a tough task.
- A regional war in the Middle East could push oil prices above $150 a barrel, according to Goldman Sachs.
- The most important global trade routes would be affected by this war, from the Bab el-Mandeb strait to the Suez Canal to the Strait of Hormuz, and we are all following what is happening in the Red Sea today.
- Sources indicate that the U.S. Securities and Exchange Commission is expected to approve multiple company applications for spot Bitcoin ETFs with news expected to be released today.
Smart technical reports
How they work
A likely scenario for the day is proposed, and the probability of this scenario being achieved, according to technical analysis, could be between 60% and 75%. If the first scenario fails, the probability of the second scenario being achieved will be between 60% and 75%.
The first scenario fails when the price reaches the alternative scenario condition level, the alternative scenario is then immediately activated, and the first scenario prediction gets cancelled.
These reports are not considered a substitute for the trader’s decision, but rather they are a tool to assist the follower in making their own decisions, as a reference based on classical technical analysis.
GOLD
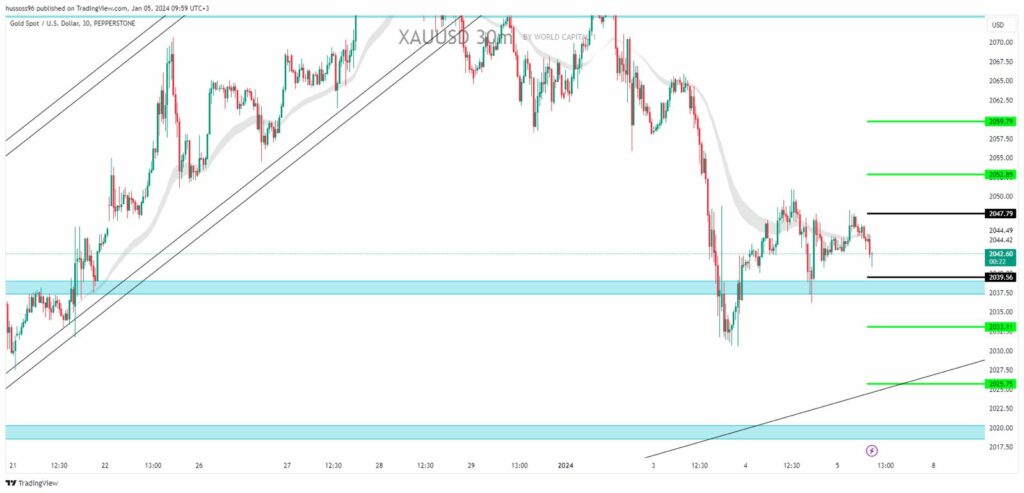
General trend: bearish
Time interval: 30 minutes
Current price: $2,042.60
First scenario: Sell gold on the break of $2,039.56, targeting a price of $2,033.11 and then $2,025.75.
Alternative scenario: Buy gold on the break when steady by closing the candle above the levels of $2,047.79, targeting a price of $2,052.85 and then $2,059.79.
Comment: Trading below resistances and averages suggests a downtrend.
CRUDE OIL
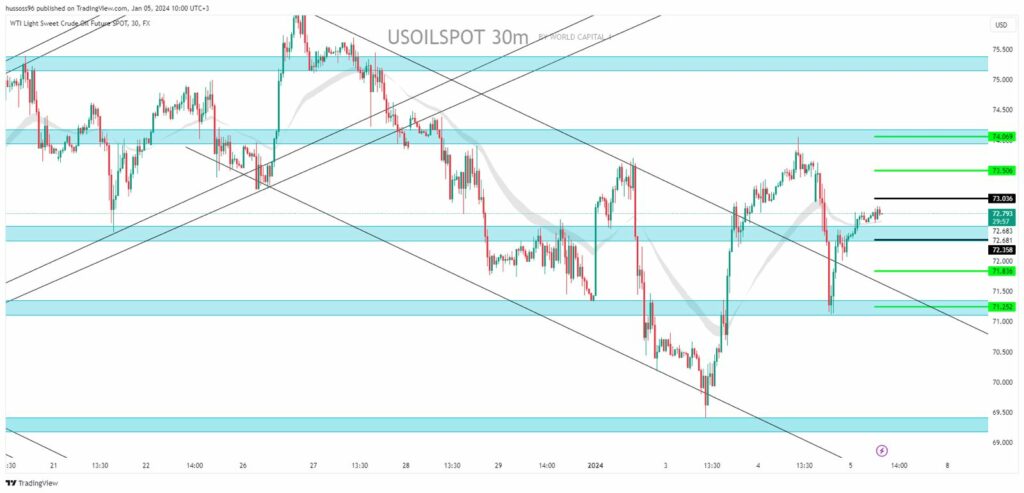
General trend: bullish
Time interval: 30 minutes
Current price: $72.79 per barrel
First scenario: Buy oil at a break of $73.03, targeting a price of $73.50 and then $74.06.
Alternative scenario: Sell oil on the level of $72.35, targeting a price of $71.83 and then $71.25.
Comment: Trading above the supports and averages suggests an uptrend.
EURUSD
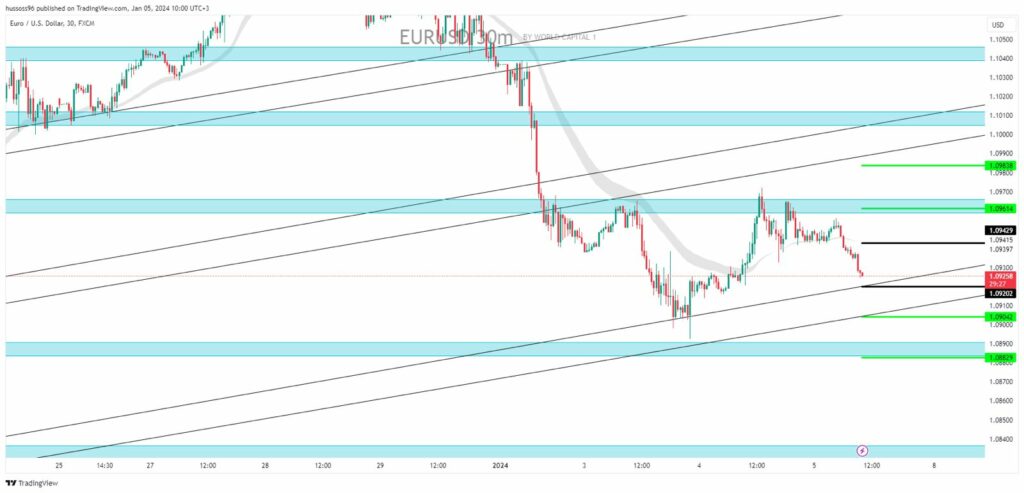
General trend: bullish
Time interval: 30 minutes
Current price: $1.09258
First scenario: Sell EURUSD on the break of $1.09202, targeting a price of $1.09042 and then $1.08829.
Alternative scenario: Buy EURUSD on the break when steady by closing the candle above the levels of $1.09429, targeting a price of $1.09614 and then $1.09838.
Comment: Trading above the supports and averages suggests an uptrend.
GBPUSD
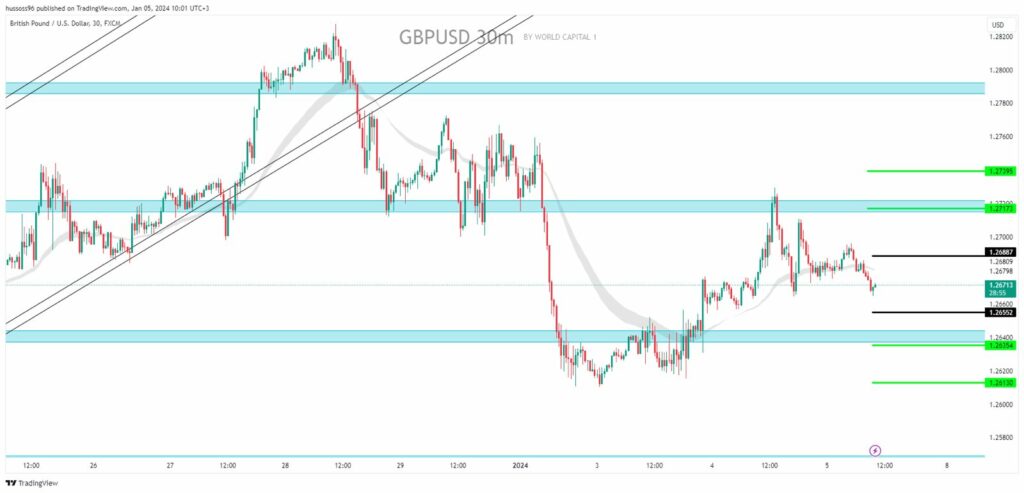
General trend: bearish
Time interval: 30 minutes
Current price: $1.26713
First scenario: Sell GBPUSD on the break of $1.26552, targeting a price of $1.26352 and then $1.26130.
Alternative scenario: Buy GBPUSD on the break when steady by closing the candle above the level of $1.26887, targeting a price of $1.27173 and then $1.27395.
Comment: Trading below resistances and averages suggests a downtrend.
NAS100
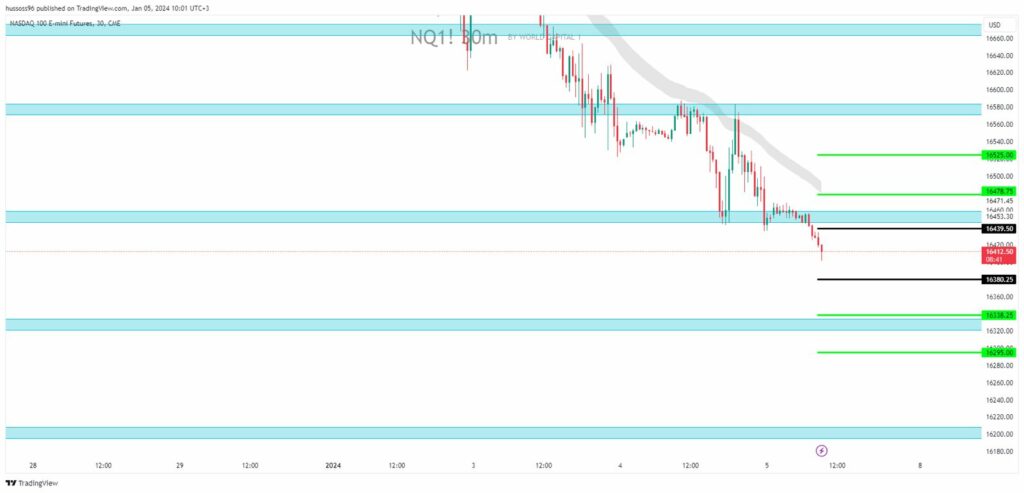
General trend: bearish
Time interval: 30 minutes
Current price: $16,412
First scenario: Sell Nasdaq on the break of $16,380, targeting a price of $16,338 and then $16,296.
Alternative scenario: Buy Nasdaq on the break when steady by closing the candle above the level of $16,439, targeting a price of $16,478 and then $16,525.
Comment: Trading below resistances and averages suggests a downtrend.
Economic Calendar
(Times are in GMT+3)
- Europe: Consumer Price Index (Annually) (December) at 13:00
- U.S: Average hourly earnings (Monthly) (December) at 16:30
- U.S.: Non-farm payrolls report (December) at 16:30
- U.S.: Unemployment rate (December) at 16:30
- U.S.: Institute for Supply Management (ISM) Non-Manufacturing Purchasing Managers’ Index (December) at 18:30
Fundamental Analysis
- The dollar index held steady around 102.5 on Friday and is on track for its best week since July, as traders scaled back their bets on early and sharp interest rate cuts from the Federal Reserve this year.
- Recent data showed that weekly jobless claims fell more than expected last week, while U.S. private companies added more workers than expected in December, highlighting the strength of the labor market.
- Investors are now looking to the upcoming monthly jobs report, which is expected to show that the U.S. economy added 170,000 jobs in December, down from 199,000 jobs in November.
- The markets now see a roughly 65% chance of a Federal Reserve rate cut in March, down from nearly 90% seen a week ago.
- The dollar rose across the board this week, with the most visible buying activity against the Japanese yen.
- Gold is headed for its first weekly decline in four weeks on Friday, as the decline in bets on an early interest rate cut in the United States boosted the dollar and bond yields, while investors await the key jobs report.
- Oil prices rose on Friday after the minutes of a Federal Reserve meeting indicated that inflation is under control and as U.S. Secretary of State Antony Blinken prepares to visit the Middle East to try to prevent the escalation of the conflict between Israel and Gaza.
Risk Disclaimer
Any information/articles/materials/content provided by WRC1 or displayed on its website is intended to be used solely for educational purposes only and does not constitute investment advice or a consultation on how the client should trade.
Although WRC1 has taken care to ensure that the content of such information is accurate, - it cannot be held responsible for any omission/error/miscalculation and cannot guarantee the accuracy of any material or any information contained herein.
Therefore, any reliance you place on such material is strictly at your own risk. Please note that the responsibility for using or relying on such material rests with the client and WRC1 accepts no liability for any loss or damage, including without limitation, any loss of profit which may arise directly or indirectly from the use of or reliance on such information.
Risk Warning: FX/CFDs are complex instruments and carry a high risk of losing money quickly due to leverage. You should consider whether you understand how FX/CFDs work and whether you can afford to take the high risk of losing your money.
You should make sure that, depending on your country of residence, you are allowed to trade with WRC1 products. Please ensure that you are familiar with the company’s risk disclosure.
