 en
enDaily Analysis 02/02/2024
Latest Economic and Fundamental Insights
- The dollar index held onto its recent decline to around 103 on Friday and is set to end the week lower as expectations of US interest rate cuts remained intact despite opposition from the Federal Reserve.
- Gold is set for its best week in nine as the dollar retreats ahead of US data
- The US federal funds rate was kept at 5.50%
- Markets are pricing in more than 140 basis points of total Federal Reserve rate cuts this year, up from around 130 basis points previously.
- Oil gains after OPEC+ sticks to output cuts, but heads for weekly losses, with Brent crude trading at $79.00 and WTI crude at $74.00.
- Asian stocks rise as US tech rally resumes, focus on payrolls
- Alphabet’s Google beats on post-earnings earnings, shares down 8% after record high
- Apple reports better-than-expected fiscal fourth quarter 2023 results
- Earnings per share of $2.18 vs. $2.10 expected
- Revenue of $119.58 billion vs. $117.91 billion expected
- Meta announces $50 billion share buyback, stock up 12% to over $440 after earnings beat, share buyback program and dividend announcement
- Amazon reports better-than-expected quarterly results
- Earnings per share of $1.00 vs. $0.80 expected
- Revenue of $170 billion vs. $166.2 billion expected
- Bitcoin steadies at $43,000 as selloff in regional US bank stocks sparks risk aversion
Smart technical reports
How they work
A likely scenario is proposed for today, and the probability of this scenario being achieved, according to technical analysis, may be between 60% and 75%.
If the first scenario fails, the probability of the second scenario being achieved will be between 60% and 75% certain.
The first scenario fails when the price reaches the level of the alternative scenario condition, and the alternative scenario is immediately activated and the prediction from the first scenario is cancelled.
These reports are not considered a substitute for the trader’s decision, but rather they are a tool to assist the follower in making his own decisions, as a reference based on the origins of classical technical analysis.
GOLD
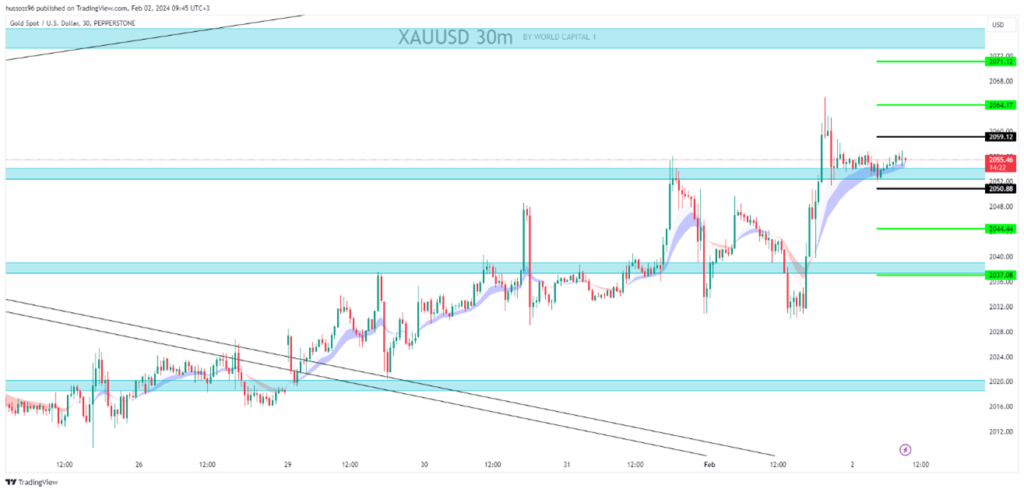
General trend: bullish
Time interval: half an hour (30 minutes)
Current price: 2042.66 The first scenario: Buying gold at a fraction and remaining above 2059.12, targeting the price of 2064.17 and 2071.12 Alternative scenario: Selling gold at a fraction and remaining below 2050.88, targeting the price of 2044.44 and then 2037.08
Comment: Trading above supports and averages suggests an upward trend.
CRUDE OIL
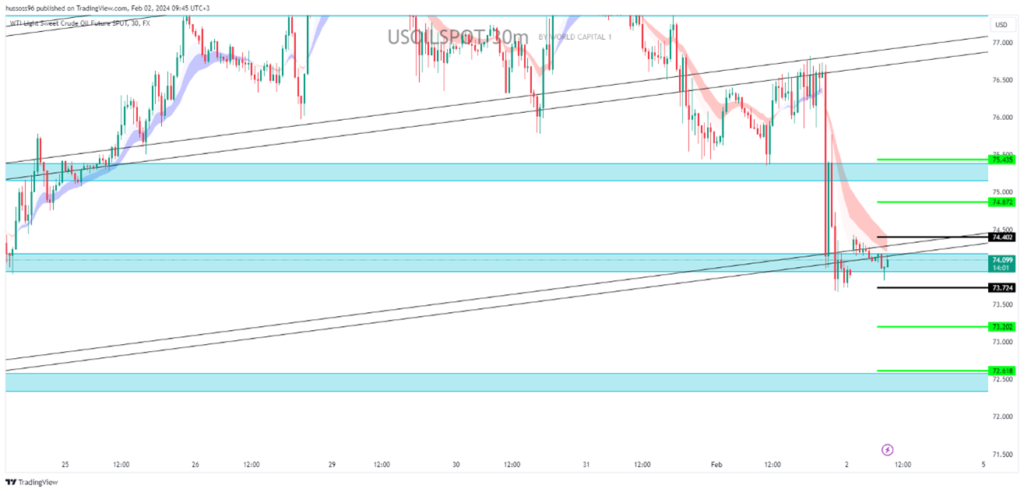
Trend: bullish
Time interval: half an hour (30 minutes)
Current price: $74.09 per barrel First scenario: Buy oil at a break and hold by closing the candle at the highest levels of $74.40, targeting a price of $74.87, then 75.43. Alternative scenario: Selling oil at a break of $73.72, targeting a price of $73.20, then 72.61
Comment: Trading above supports and averages suggests an upward trend.
EURUSD
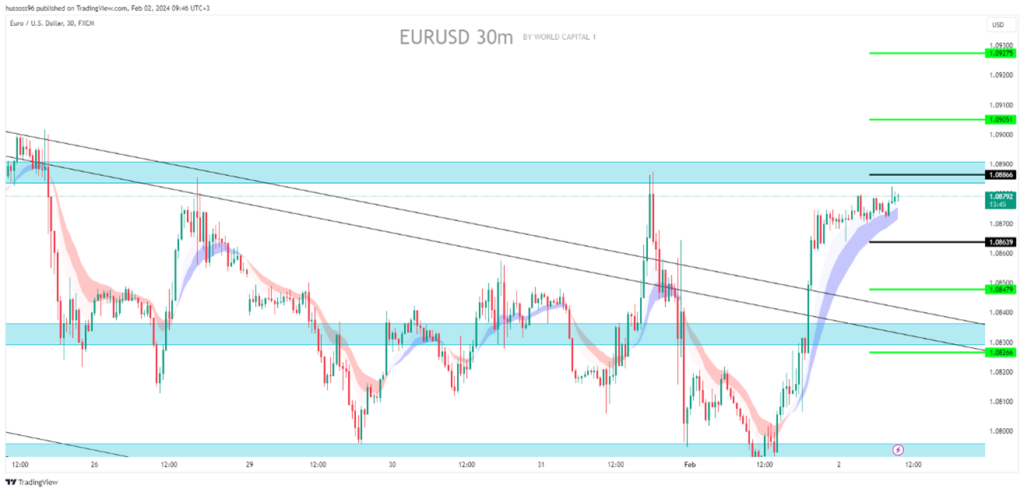
General trend:- Bullish
Time interval: half an hour (30 minutes)
Current price: 1.08792 First scenario: Buying the euro/dollar at a break of 1.08866, targeting a price of 1.09051 then 1.09275 Alternative scenario: selling the euro/dollar at a break of 1.08639, targeting a price of 1.08479 then 1.08266
Comment: Trading above supports and averages suggests an upward trend.
GBPUSD
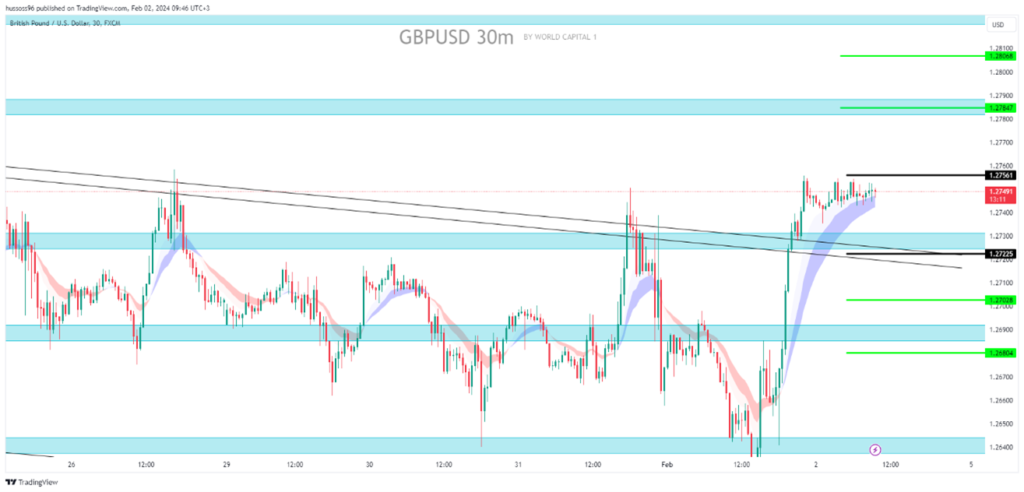
Trend: bullish
Time interval: half an hour (30 minutes)
Current price: 1.27491 First scenario: Buy the pound dollar at a break and hold at the highest level of 1.27561, targeting a price of 1.27847 then 1.28068 Alternative scenario: sell the pound dollar at a break and hold at a close below 1.27225, targeting a price of 1.27028 then 1.26804
Comment: Trading above supports and averages suggests an upward trend.
NAS100
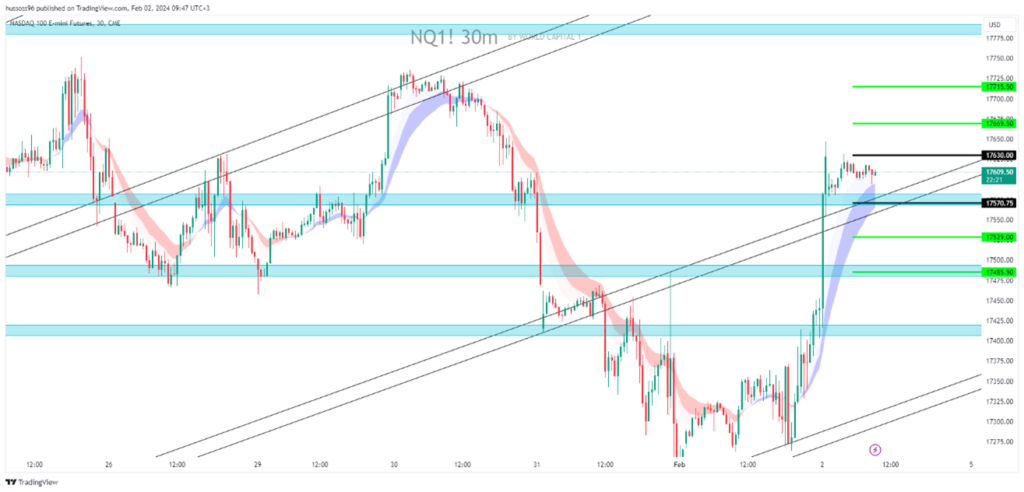
Trend: bullish
Time interval: half an hour (30 minutes)
Current price: 17609 The first scenario: Buying the Nasdaq at a break and holding steady with a close above 17630, targeting a price of 17669 then 17715 Alternative scenario: Selling the Nasdaq at a break and holding steady with a close below 17570 targeting a price of 17529 then 17485
Comment: Trading above supports and averages suggests an upward trend.
Economic Calendar
(Times are in GMT+3)
- From United States – Average Hourly Earnings (Monthly) (January) 16:30
- From United States – Private Employment Report (January) 16:30
- From United States – Unemployment Rate (January) 16:30
Fundamental Analysis
- The dollar index held onto its recent decline to around 103 on Friday and is set to end the week lower as expectations of US interest rate cuts remained intact despite opposition from the Federal Reserve.
- Investors are also awaiting the closely watched monthly jobs report on Friday for further guidance on the interest rate outlook.
- On Wednesday, Federal Reserve Chair Jerome Powell said a March cut is “not the base case” and reiterated the commitment to keep rates at their current level until it is clear that inflation is moving towards the 2% target.
- Markets now see a 38% chance of a Fed rate cut in March, down significantly from more than 70% a month ago.
- Analysts are betting that the central bank will start cutting rates in mid-2024 and will deliver a total of three rate cuts this year.
- The dollar also faced pressure from an improvement in risk appetite as evidenced by a global rally in stocks.
- Gold prices are poised for their biggest weekly gain in nine weeks on Friday as dollar and Treasury yields retreat, with traders awaiting key US jobs data due later in the day for clues on when the Federal Reserve might start cutting interest rates.
- Oil prices rose in early trading on Friday after OPEC+ decided to keep its oil production policy unchanged, although benchmarks are headed for weekly losses amid unconfirmed reports of a ceasefire between Israel and Hamas.
Risk Disclaimer
Any information/articles/materials/content provided by WRC1 or displayed on its website is intended to be used solely for educational purposes only and does not constitute investment advice or a consultation on how the client should trade.
Although WRC1 has taken care to ensure that the content of such information is accurate, - it cannot be held responsible for any omission/error/miscalculation and cannot guarantee the accuracy of any material or any information contained herein.
Therefore, any reliance you place on such material is strictly at your own risk. Please note that the responsibility for using or relying on such material rests with the client and WRC1 accepts no liability for any loss or damage, including without limitation, any loss of profit which may arise directly or indirectly from the use of or reliance on such information.
Risk Warning: FX/CFDs are complex instruments and carry a high risk of losing money quickly due to leverage. You should consider whether you understand how FX/CFDs work and whether you can afford to take the high risk of losing your money.
You should make sure that, depending on your country of residence, you are allowed to trade with WRC1 products. Please ensure that you are familiar with the company’s risk disclosure.
