 en
enDaily Analysis 02/01/2024
Latest Economic and Fundamental Insights
- The dollar index rose above 101.5 on Tuesday, extending its winning streak to three sessions in a potential technical rebound as investors continued to assess the Federal Reserve’s monetary policy outlook amid moderating inflation pressures and weak growth drivers.
- Gold rose on hopes of interest rate cuts by the Federal Reserve; upcoming U.S. data in focus.
- The focus shifts to the minutes of the U.S. Federal Reserve meeting on Thursday.
- Oil rose in the first session of 2024, trading at $78 a barrel for Brent crude and $73 a barrel for West Texas Intermediate.
- U.S. stock index futures turned red.
- The yield on the U.S. 10-year Treasury note rose to around 3.89%.
- Bitcoin rose above $45,000 for the first time since April 2022. Rising bets on rate cuts are also boosting risk appetite and investment in the cryptocurrency.
Smart technical reports
How they work
A likely scenario for the day is proposed, and the probability of this scenario being achieved, according to technical analysis, could be between 60% and 75%. If the first scenario fails, the probability of the second scenario being achieved will be between 60% and 75%.
The first scenario fails when the price reaches the alternative scenario condition level, the alternative scenario is then immediately activated, and the first scenario prediction gets cancelled.
These reports are not considered a substitute for the trader’s decision, but rather they are a tool to assist the follower in making their own decisions, as a reference based on classical technical analysis.
GOLD
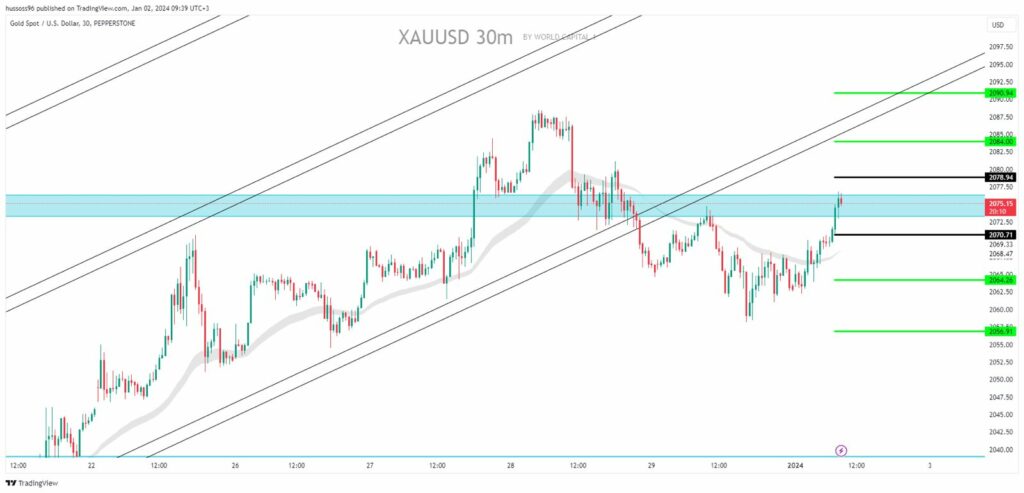
General trend: bullish
Time interval: 30 minutes
Current price: $2,075.15
First scenario: Buy gold on the break when steady by closing the candle above the levels of $2,078.94, targeting a price of $2,084.00 and then $2,090.94.
Alternative scenario: Sell gold on the break of $2,070.71, targeting a price of $2,064.26 and then $2,056.91.
Comment: Trading above the supports and averages suggests an uptrend.
CRUDE OIL
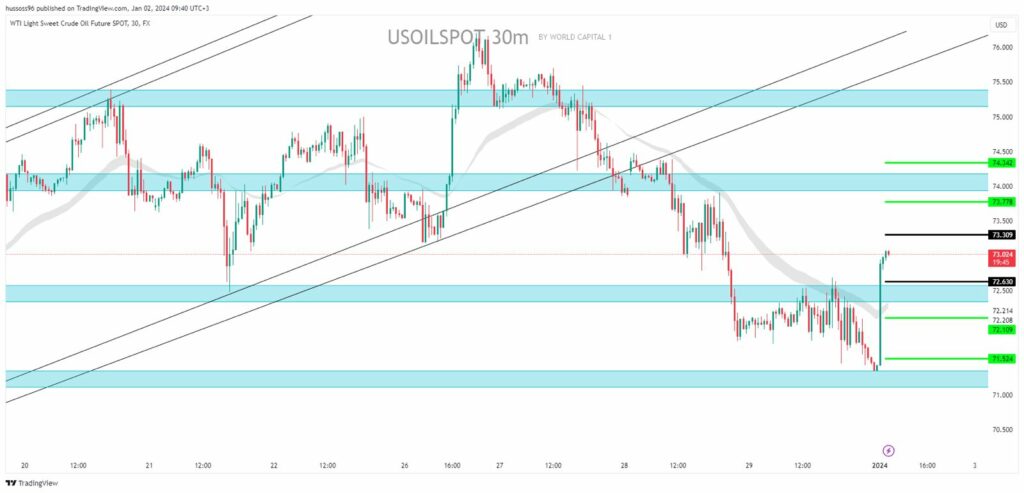
General trend: bearish
Time interval: 30 minutes
Current price: $73.02 per barrel
First scenario: Sell oil on the of $72.63, targeting a price of $72.10 and then $71.52.
Alternative scenario: Buy oil at a break of $73.30, targeting a price of $73.77 and then $74.34.
Comment: Trading below resistances and averages suggests a downtrend.
EURUSD
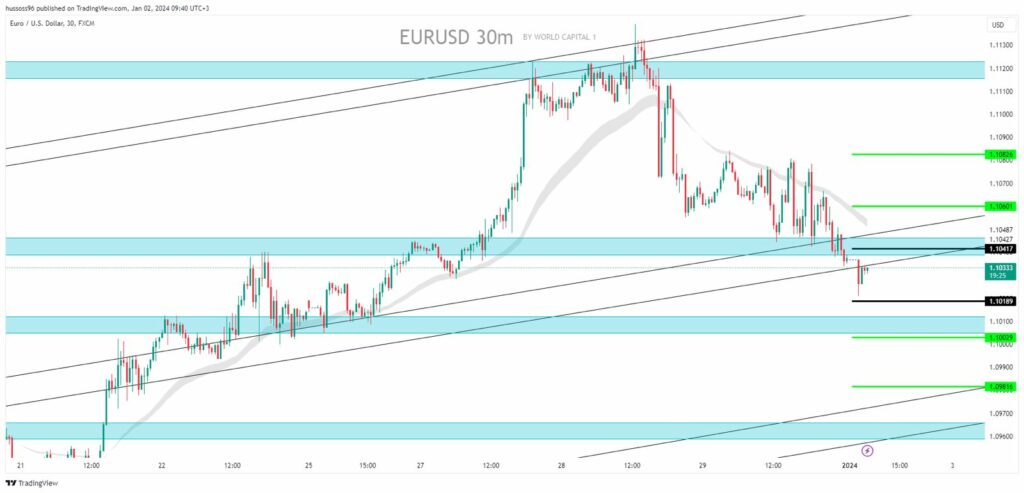
General trend: bullish
Time interval: 30 minutes
Current price: $1.10333
First scenario: Buy EURUSD on the break when steady by closing the candle above the levels of $1.10417, targeting a price of $1.10601 and then $1.10826.
Alternative scenario: Sell EURUSD on the break of $1.10189, targeting a price of $1.10029 and then $1.09816.
Comment: Trading above the supports and averages suggests an uptrend.
GBPUSD
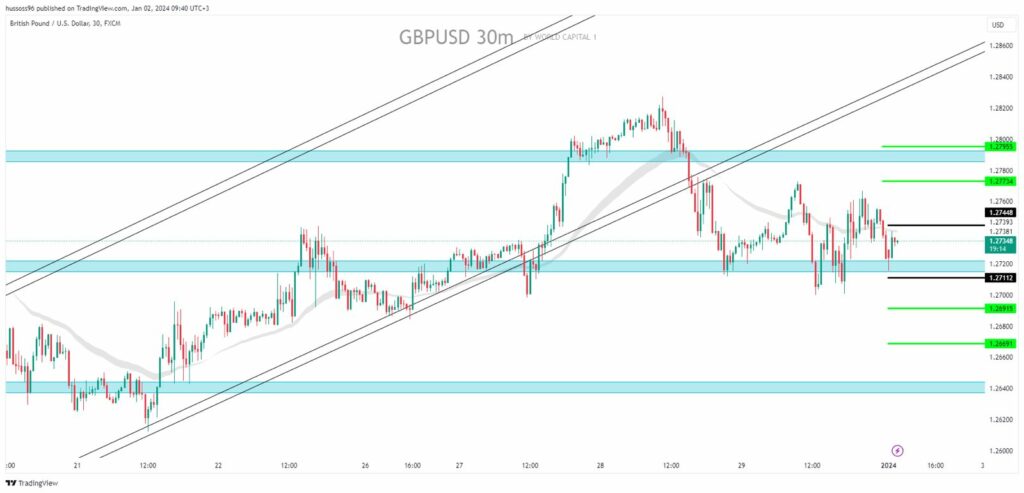
General trend: bearish
Time interval: 30 minutes
Current price: $1.27348
First scenario: Sell GBPUSD on the break of $1.27112, targeting a price of $1.26915 and then $1.26691.
Alternative scenario: Buy GBPUSD on the break when steady by closing the candle above the level of $1.27448, targeting a price of $1.27734 and then $1.27955.
Comment: Trading below resistances and averages suggests a downtrend.
NAS100
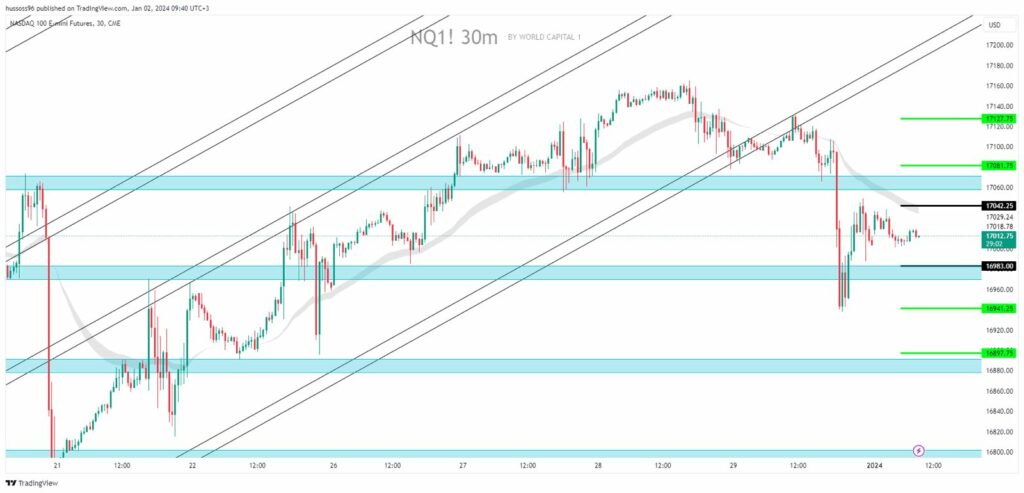
General trend: bearish
Time interval: 30 minutes
Current price: $17,012
First scenario: Sell Nasdaq on the break of $16,983, targeting a price of $16,941 and then $16,897.
Alternative scenario: Buy Nasdaq on the break when steady by closing the candle above the level of $17,042, targeting a price of $17,081 and then $17,127.
Comment: Trading below resistances and averages suggests a downtrend.
Economic Calendar
(Times are in GMT+3)
- US: the Purchasing Managers’ Index (December) at 17:45
Fundamental Analysis
- The dollar index rose above 101.5 on Tuesday, extending its winning streak to three sessions in a potential technical rebound as investors continued to assess the Federal Reserve’s monetary policy outlook amid moderating inflation pressures and weak growth drivers.
- The market is still pricing in a roughly 90% chance that the central bank will start cutting interest rates in March, with analysts pointing to the dominant question of how far the Fed will have to ease monetary policy.
- Traders are now looking ahead to key data releases this week, including job openings and non-farm payrolls, as well as the minutes of the Federal Reserve’s December meeting.
- Meanwhile, investors are less confident that the European Central Bank and the Bank of England will cut borrowing costs as quickly, as both central banks have held their hawkish stance on rates for longer.
- Elsewhere, the Bank of Japan is still under pressure to abandon its negative interest rate policy.
- Gold prices rose on Tuesday, supported by the prospect of the Federal Reserve cutting interest rates in 2024, as investors look to a series of economic data this week for more clarity on U.S. interest rate expectations.
- “There was a change in tone at the December FOMC meeting, so traders will be looking for more clarity on this dovish tilt, especially with regard to what Fed officials are looking for,” said Wong, analyst at OANDA.
- West Texas Intermediate crude futures rose above $72 a barrel on the first day of trading in 2024 amid concerns that rising geopolitical tensions in the Middle East could disrupt supply.
- Over the weekend, U.S. Navy helicopters destroyed three Houthi boats that attempted to board a container ship in the Red Sea, killing several people in the process.
- An Iranian news agency with close ties to the country’s security establishment said on Monday that an Iranian destroyer had been deployed to the Red Sea.
- At the same time, oil prices have remained under pressure from concerns about rising global supplies, particularly from non-OPEC producers, and doubts on the demand side.
- The United States reached a record level of crude oil production, estimated at about 13.3 million barrels per day in the latest reporting period, in line with record production in Brazil and Guyana.
Risk Disclaimer
Any information/articles/materials/content provided by WRC1 or displayed on its website is intended to be used solely for educational purposes only and does not constitute investment advice or a consultation on how the client should trade.
Although WRC1 has taken care to ensure that the content of such information is accurate, - it cannot be held responsible for any omission/error/miscalculation and cannot guarantee the accuracy of any material or any information contained herein.
Therefore, any reliance you place on such material is strictly at your own risk. Please note that the responsibility for using or relying on such material rests with the client and WRC1 accepts no liability for any loss or damage, including without limitation, any loss of profit which may arise directly or indirectly from the use of or reliance on such information.
Risk Warning: FX/CFDs are complex instruments and carry a high risk of losing money quickly due to leverage. You should consider whether you understand how FX/CFDs work and whether you can afford to take the high risk of losing your money.
You should make sure that, depending on your country of residence, you are allowed to trade with WRC1 products. Please ensure that you are familiar with the company’s risk disclosure.
