 en
enDaily Analysis 01/02/2024
Latest Economic and Fundamental Insights
- The dollar index held above 103.5 on Thursday, hovering near its highest level in seven weeks, as Federal Reserve Chairman Jerome Powell poured cold water on bets on a March rate cut.
- Gold prices rose as traders assessed hopes for a significant rate cut from the Federal Reserve.
- The Federal Reserve kept the U.S. interest rate steady at 5.50%.
- The depth of cuts in 2024 is expected to reach 166 basis points, up from about 130 basis points a week ago.
- Markets are pricing in more than 140 basis points in total Federal Reserve rate cuts this year, up from about 130 basis points previously.
- Oil prices fell to their lowest levels in a week but rebounded in Asian trading on expectations of a rate cut from the Federal Reserve, trading at $82.00 a barrel for Brent crude and $75.00 a barrel for West Texas Intermediate.
- The Nasdaq Composite index fell 0.8% as traders fled technology stocks amid earnings season.
- Microsoft reported record revenue of $62 billion thanks to buoyant cloud growth, with shares falling.
- China’s Caixin Manufacturing Purchasing Managers’ Index (PMI) held steady in January.
- Cryptocurrencies tumbled on Wednesday, with bitcoin {{BTC}} falling below $43,000 as hawkish comments from Federal Reserve Chairman Jerome Powell dampened hopes of an imminent rate cut.
Smart technical reports
How they work
A likely scenario is proposed for today, and the probability of this scenario being achieved, according to technical analysis, may be between 60% and 75%.
If the first scenario fails, the probability of the second scenario being achieved will be between 60% and 75% certain.
The first scenario fails when the price reaches the level of the alternative scenario condition, and the alternative scenario is immediately activated and the prediction from the first scenario is cancelled.
These reports are not considered a substitute for the trader’s decision, but rather they are a tool to assist the follower in making his own decisions, as a reference based on the origins of classical technical analysis.
GOLD
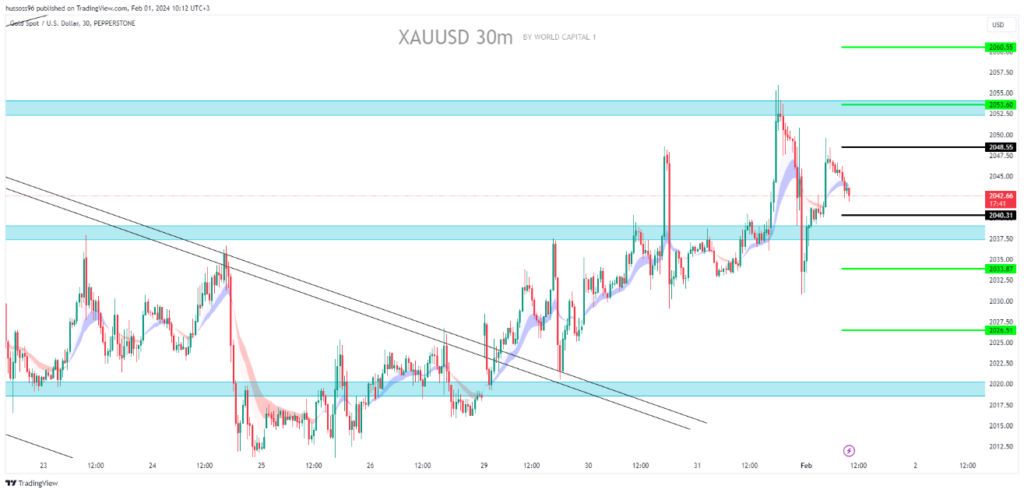
General trend: bullish
Time interval: half an hour (30 minutes)
Current price: 2042.66 The first scenario: Buy gold at a fraction and hold above 2048.55, targeting the price of 2053.60 and 2060.55. Alternative scenario: Sell gold at a break and hold below 2040.31, targeting the price of 2033.87 and then 2026.51.
Comment: Trading above supports and averages suggests an upward trend.
CRUDE OIL
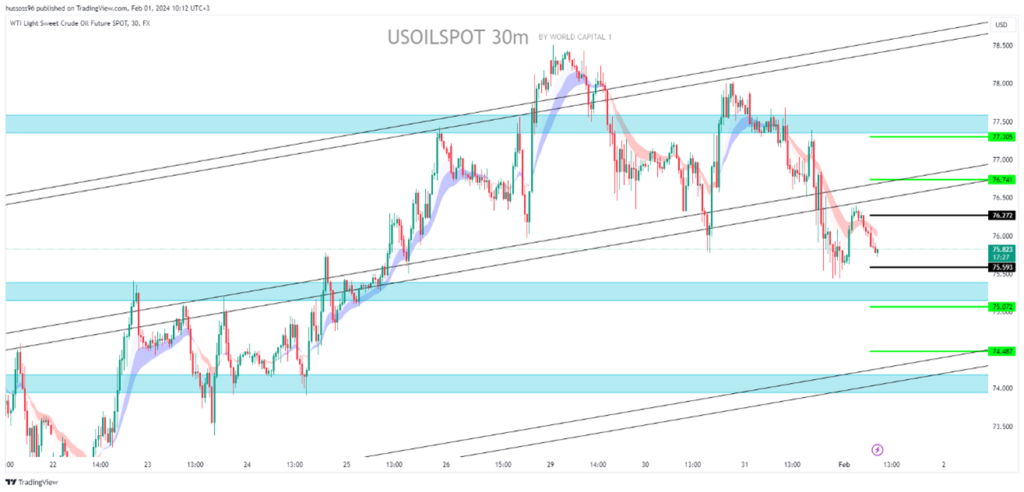
Trend: bullish
Time interval: half an hour (30 minutes)
Current price: $75.82 per barrel. First scenario: Buying oil at a break and holding steady by closing the candle at the highest levels of $76.27, targeting a price of $76.74, then 77.30. Alternative scenario: Selling oil at a break of $75.59, targeting a price of $75.07, then 74.48.
Comment: Trading above supports and averages suggests an upward trend.
EURUSD
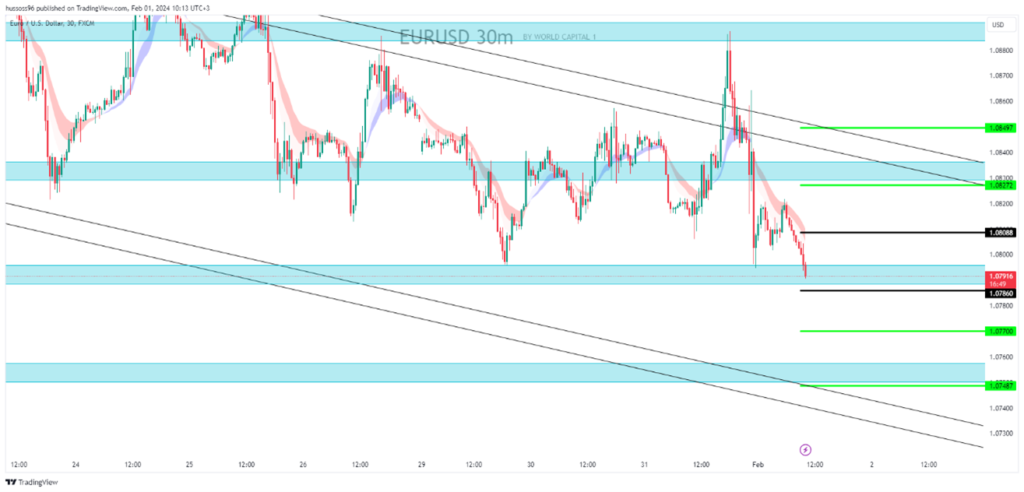
General trend: – Bearish
Time interval: half an hour (30 minutes)
Current price: 1.07916 First scenario: Sell the euro/dollar at a break of 1.07860, targeting a price of 1.07700, then 1.07487. Alternative scenario: Buy the euro/dollar at a break of 1.08088, targeting a price of 1.08272, then 1.08497.
Comment: Trading below resistances and averages suggests a decline
GBPUSD
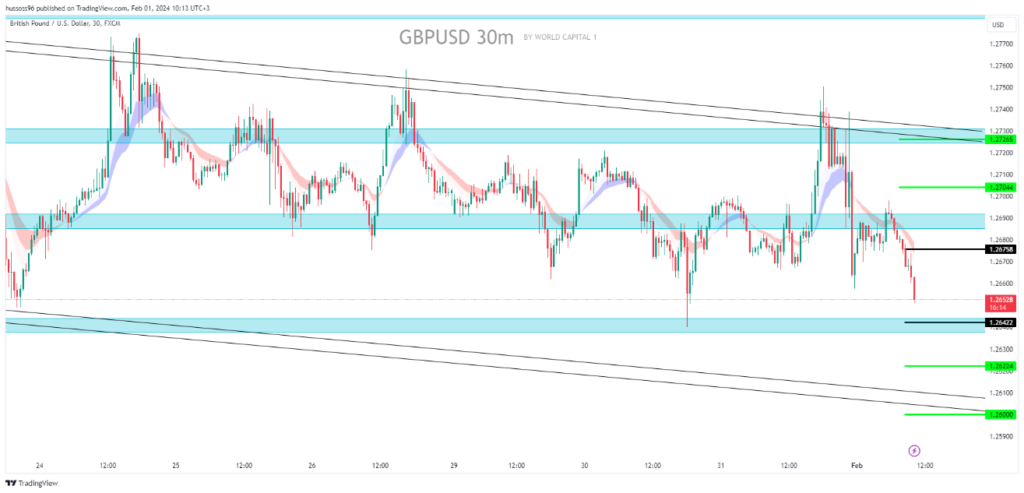
Trend: down
Time interval: half an hour (30 minutes)
Current price: 1.26528 The first scenario: Selling the pound for dollars at a break and holding below the level of 1.26422, targeting a price of 1.26224 then 1.26000 Alternative scenario: Buying a pound for dollars at a break and holding at a close above 1.26758, targeting a price of 1.27044 then 1.27265
Comment: Trading below resistances and averages leads to a decline
NAS100
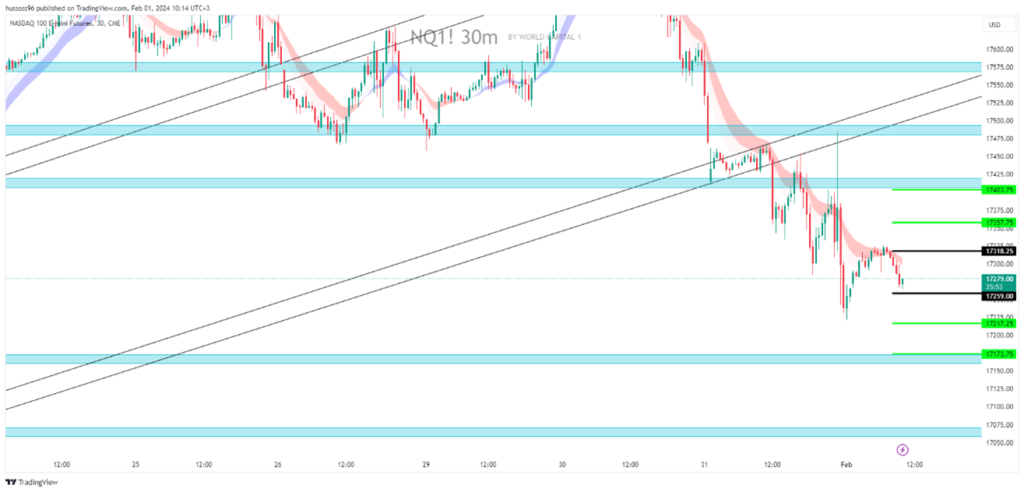
Trend: down
Time interval: half an hour (30 minutes)
Current price: 17279 The first scenario: sell Nasdaq at a break and hold with a close below 17259, targeting a price of 17217 then 17173 Alternative scenario: buy Nasdaq at a break and hold with a close above 17318 targeting a price of 17357 then 17403
Comment: Trading below resistances and averages leads to a decline
Economic Calendar
(Times are in GMT+3)
- From Europe Annual CPI (January) 13:00
- Bank of England Interest Decision (January) 15:00
- From the United States of America, initial unemployment claims 16:30
- From the United States of America Manufacturing PMI 17:45
- From the United States of America, the Manufacturing Purchasing Managers’ Index issued by the Institute for Supply Management (ISM) (January) 18:00
- Bank of Canada Governor Macklem Speech 19:30
Fundamental Analysis
- The dollar index held above 103.5 on Thursday, hovering near its highest level in seven weeks, as Federal Reserve Chairman Jerome Powell poured cold water on bets on a March rate cut.
- During the Fed’s press conference, Powell said that a cut in March “is not the baseline” and reaffirmed the commitment to keeping interest rates at their current level until inflation is moving towards its 2% target.
- Markets now see a 38% chance of a Fed rate cut in March, down significantly from 89% a month ago.
- Investors are now looking to weekly jobless claims and ISM manufacturing purchasing managers’ index reports on Thursday, as well as the much-anticipated monthly jobs report on Friday.
- The dollar rose against most major currencies but fell against the Japanese yen as problems at the U.S. regional bank New York Community Bancorp led to a rush to safer assets.
- Gold rose for the fourth day in a row on Thursday as investors clung to hopes that the Federal Reserve will cut interest rates by a significant margin this year, even after the Fed backed away from the idea of a cut in March.
- Oil prices rose on Thursday, supported by signals from the Federal Reserve about a possible start to rate cuts, and as China unveiled new support measures for its troubled property market.
Risk Disclaimer
Any information/articles/materials/content provided by WRC1 or displayed on its website is intended to be used solely for educational purposes only and does not constitute investment advice or a consultation on how the client should trade.
Although WRC1 has taken care to ensure that the content of such information is accurate, - it cannot be held responsible for any omission/error/miscalculation and cannot guarantee the accuracy of any material or any information contained herein.
Therefore, any reliance you place on such material is strictly at your own risk. Please note that the responsibility for using or relying on such material rests with the client and WRC1 accepts no liability for any loss or damage, including without limitation, any loss of profit which may arise directly or indirectly from the use of or reliance on such information.
Risk Warning: FX/CFDs are complex instruments and carry a high risk of losing money quickly due to leverage. You should consider whether you understand how FX/CFDs work and whether you can afford to take the high risk of losing your money.
You should make sure that, depending on your country of residence, you are allowed to trade with WRC1 products. Please ensure that you are familiar with the company’s risk disclosure.
